JGR Planets (2022) https://doi.org/10.1029/2022JE007220
L. Soret, J.-C. Gérard, S. Aoki, L. Gkouvelis, I. R. Thomas, B. Ristic, B. Hubert, Y. Willame, C. Depiesse, A.C. Vandaele, M. R. Patel, J. P. Mason, F. Daerden, J.-J. López-Moreno, G. Bellucci
The UVIS (UV and Visible Spectrometer) channel of the NOMAD (Nadir and Occultation for MArs Discovery) spectrometer aboard the ExoMars Trace Gas Orbiter has made limb observations of the Martian dayglow during more than a Martian year. Two pointing modes have been applied: (1) in the inertial mode, the spectrometer scans the atmosphere twice down to near the surface and provides altitude profiles of the dayglow; (2) in the tracking mode, the atmosphere is scanned at varying latitudes at a nearly constant altitude through the entire observation. We present a statistical study of the vertical and seasonal distribution of the recently discovered oxygen green and red lines at 557.7 nm and 630 nm. It indicates that the brightness of the green line emission responds to changes in the Lyman-α flux. The peak altitude of the green line emission increases seasonally when the Sun-Mars distance decreases. The lower peak of the green line statistically drops by 15-20 km between perihelion and aphelion at mid- to high altitude. The main lower peak intensity shows an asymmetry between the two hemispheres. It is significantly brighter and more pronounced in the southern hemisphere than in the north. This is a consequence of the stronger Lyman-α solar flux near perihelion. The second component of the oxygen red line at 636.4 nm is also detected for the first time in the Martian atmosphere. A photochemical model is used to simulate the variations of the green dayglow observed along limb tracking orbits.
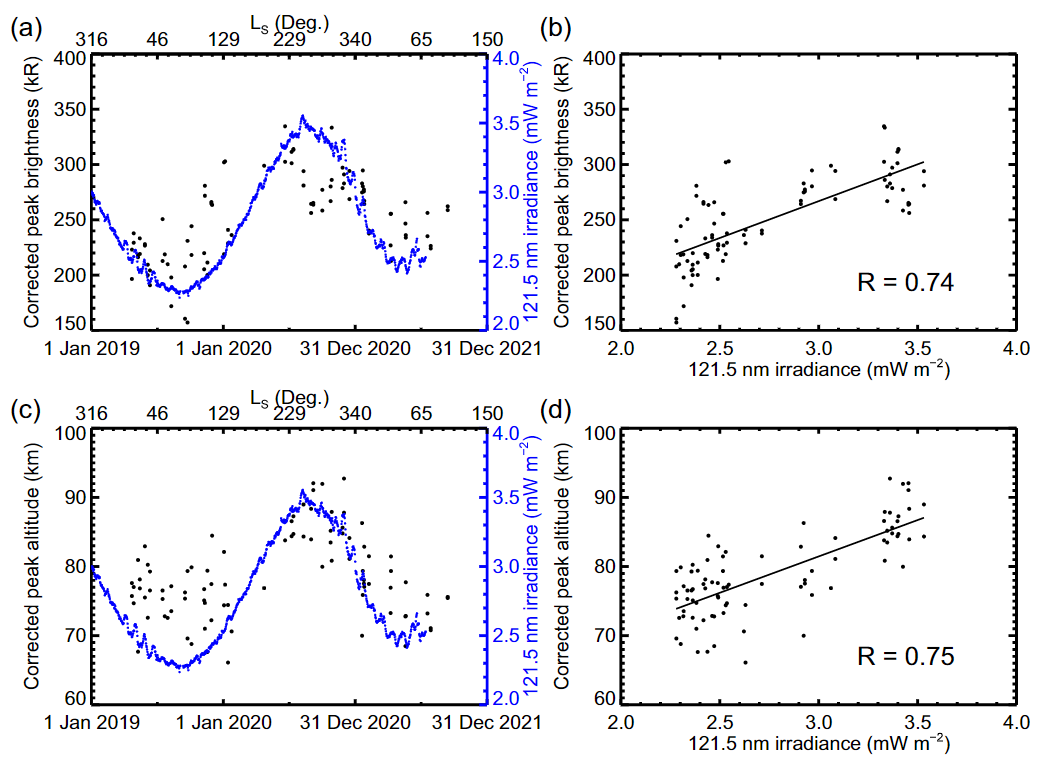
(a) Variation of the lower peak intensity of the oxygen green line along time (black dots). Intensities have been corrected from solar zenith angle (SZA) dependence. (b) A correlation with the Ly-α irradiance (blue dots) can be observed. (c) Variation of the lower peak altitude of the oxygen green line along time (black dots). Altitudes have been corrected from SZA dependence. (d) A clear correlation with the Ly-α irradiance (blue dots) can be observed.