JGR Planets (2022) https://doi.org/10.1029/2022JE007206
S. Aoki, L. Gkouvelis, J.-C. Gérard, L. Soret, B. Hubert, M. A. Lopez-Valverde, F. González-Galindo, H. Sagawa, I. R. Thomas, B. Ristic, Y. Willame, C. Depiesse, J. Mason, M. R. Patel, G. Bellucci, J.-J. Lopez-Moreno, F. Daerden, A. C. Vandaele
The upper mesosphere and lower thermosphere of Mars (70-150 km) is of high interest because it is a region affected by climatological/meteorological events in the lower atmosphere and external solar forcing. However, only a few measurements are available at this altitude range. OI 557.7 nm dayglow emission has been detected at these altitudes by the limb observations with Nadir and Occultation for Mars Discovery (NOMAD) aboard the ExoMars Trace Gas Orbiter (TGO). We develop an inversion method to retrieve density and temperature at these altitudes from the OI 557.7 nm dayglow limb profiles. We demonstrate that the atmospheric density around 90 and 140 km and temperature around 80 km during the daytime can be retrieved from the TGO/NOMAD limb measurements. The retrieved densities show a large seasonal variation both around 90 and 140 km and reach maximum values around perihelion period. This can be explained by temperature variation in the lower atmosphere driven by the dust content and Sun-Mars distance. Temperature around 80 km is higher than predicted by general circulation models, which is tentatively consistent with the warm atmospheric layer recently discovered in nighttime. The temperature retrieval relies on the temperature dependence of the quenching coefficient of 1S oxygen by CO2. Further validation of this coefficient in the range of the Mars upper atmosphere is needed for the verification of the retrieved high temperature.
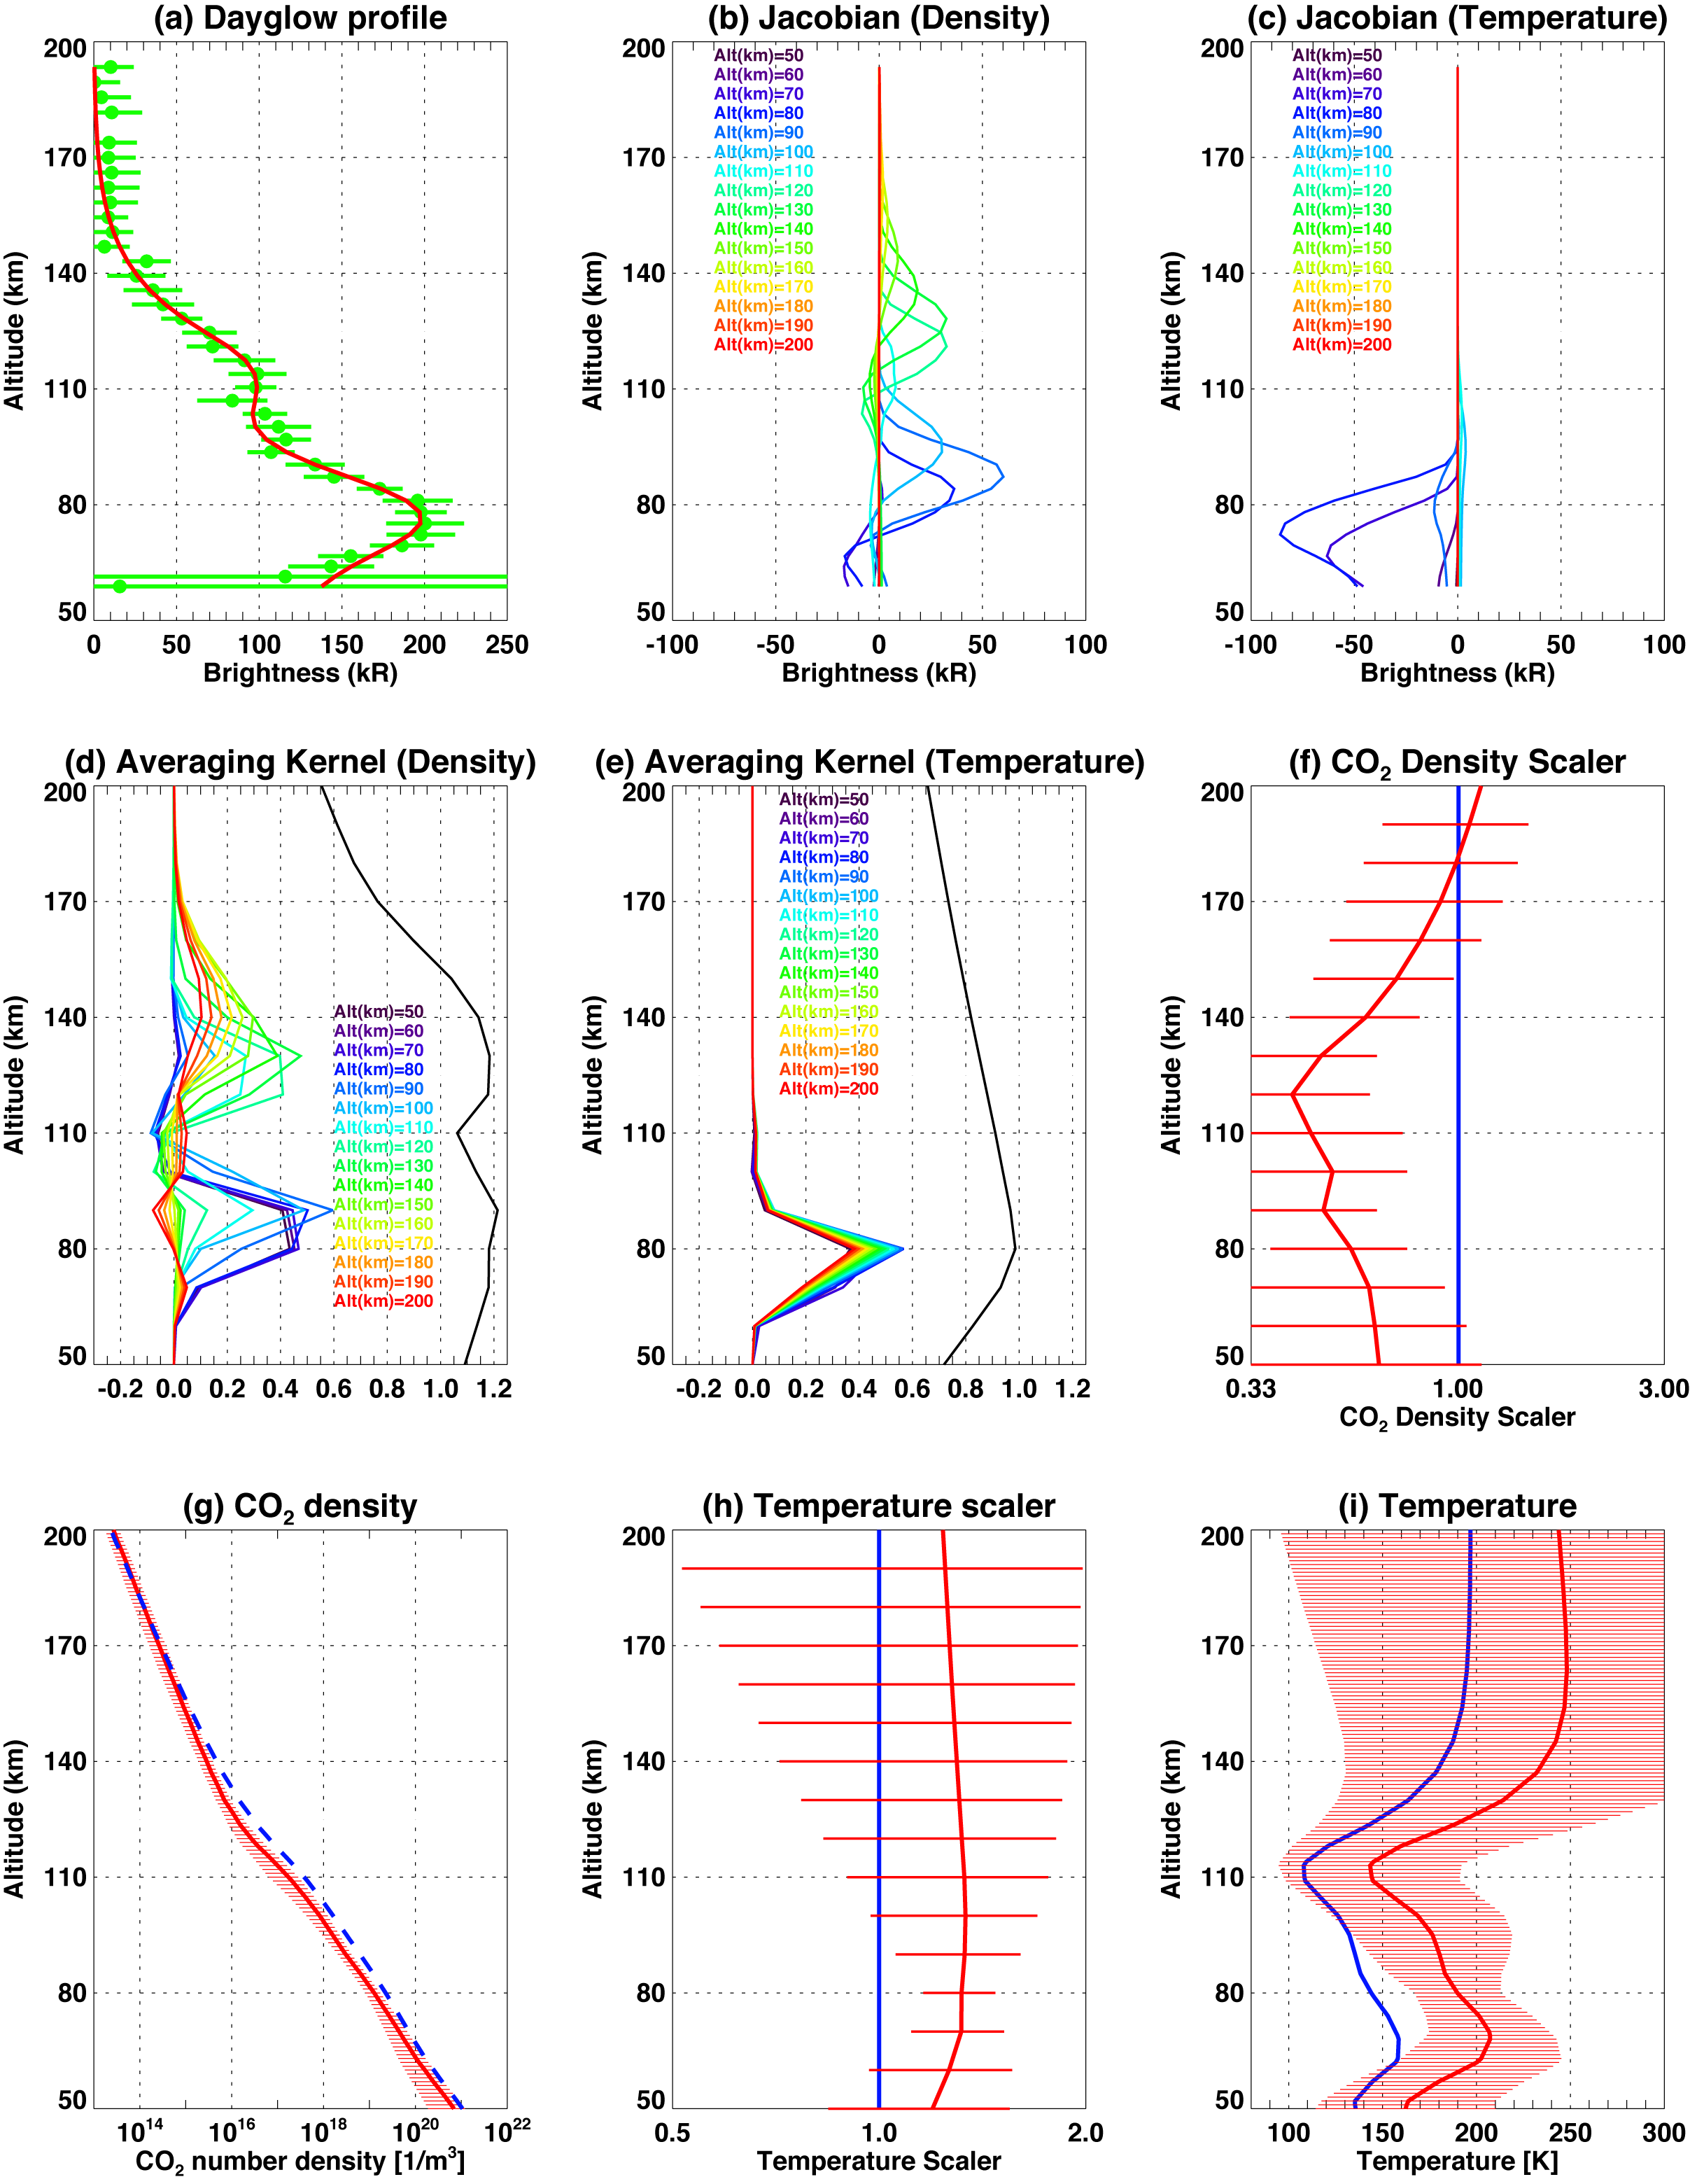
Example of the outputs from the retrieval analysis. (a) The vertical profiles of the OI dayglow brightness measured by NOMAD/UVIS and calculated by the model with the retrieved best-fit parameters (the red curve). (b) Jacobian matrix for density scaler. Each profile shows the sensitivity of the vertical profile of the dayglow brightnesswith respect to the CO2 density scaler for specific altitude (labelled in the legend). (c) Jacobian matrix for temperature scaler. (d) Averaging kernel matrix for density scaler. (e) Averaging kernel matrix for temperature scaler. Black curves in Figs. (d) and (e) present the total measurement response. (f) Retrieved CO2 density in the unit of scaler with 1-σ retrieval errors (red) relative tothe initial vertical profile given by MCD (blue). (g) Retrieved CO2 density in the unit of number density from NOMAD/UVIS (red), and the apriori CO2 number density given by MCD (blue). (h) Retrieved temperature in the unit of scaler. (i) Retrieved temperature in the unit of Kelvin from NOMAD/UVIS (red), and the a priori temperature given by MCD (blue).