Publications
JGR Planets (2026) https://doi.org/10.1029/2025JE009633
Y. Willame, L. Neary, F. Daerden, M. J. Wolff, J. T. Erwin, I. R. Thomas, S. Robert, J. P. Mason, L. Trompet, A. C. Vandaele, A. Piccialli, N. Pereira, Z. Flimon, C. Depiesse, B. Ristic, M. R. Patel, G. Bellucci, M. A. López-Valverde
We generate climatologies of ice cloud and dust optical depth derived from the NOMAD/UVIS nadir measurements onboard ExoMars Trace Gas Orbiter (TGO) for almost four Martian Years (MY), from mid MY34 to mid MY38. Our retrieval algorithm has been updated with new results for aerosol models and surface reflectance. It now uses 3 dust particle sizes: the nominal Reff = 1.5 μm, along with two larger sizes of 2.0 and 2.5 μm. The inclusion of the two larger sizes improves the retrieval during large dust loading events. We present the retrieved zonal-mean distribution of water ice cloud optical depth (OD), as well as spatial distributions for portions of the MY that highlight distinct cloud features, such as the Aphelion Cloud Belt (ACB), orographic clouds and the edges of polar clouds. The diurnal trend of ice cloud optical depth during the aphelion season is shown and agrees with recent results. We also present the retrieved seasonal zonal averaged distribution of the dust OD. We have compared our aerosol OD results (i.e., dust + ice clouds) with the measurements of MastCam and MastCam-Z onboard Curiosity and Perseverance rovers serving as ground truth validation: UVIS shows a good qualitative agreement, reproducing usually well the seasonal variations. Quantitatively, we observe UVIS values to be usually lower or similar, than MastCams' ones. We also provide and consider retrieval sensitivities of our results (altitude sensitivity, altitude profile, particle size, scattering properties) to potentially explain the differences between our nadir retrievals with the direct extinction measurements from the rovers.
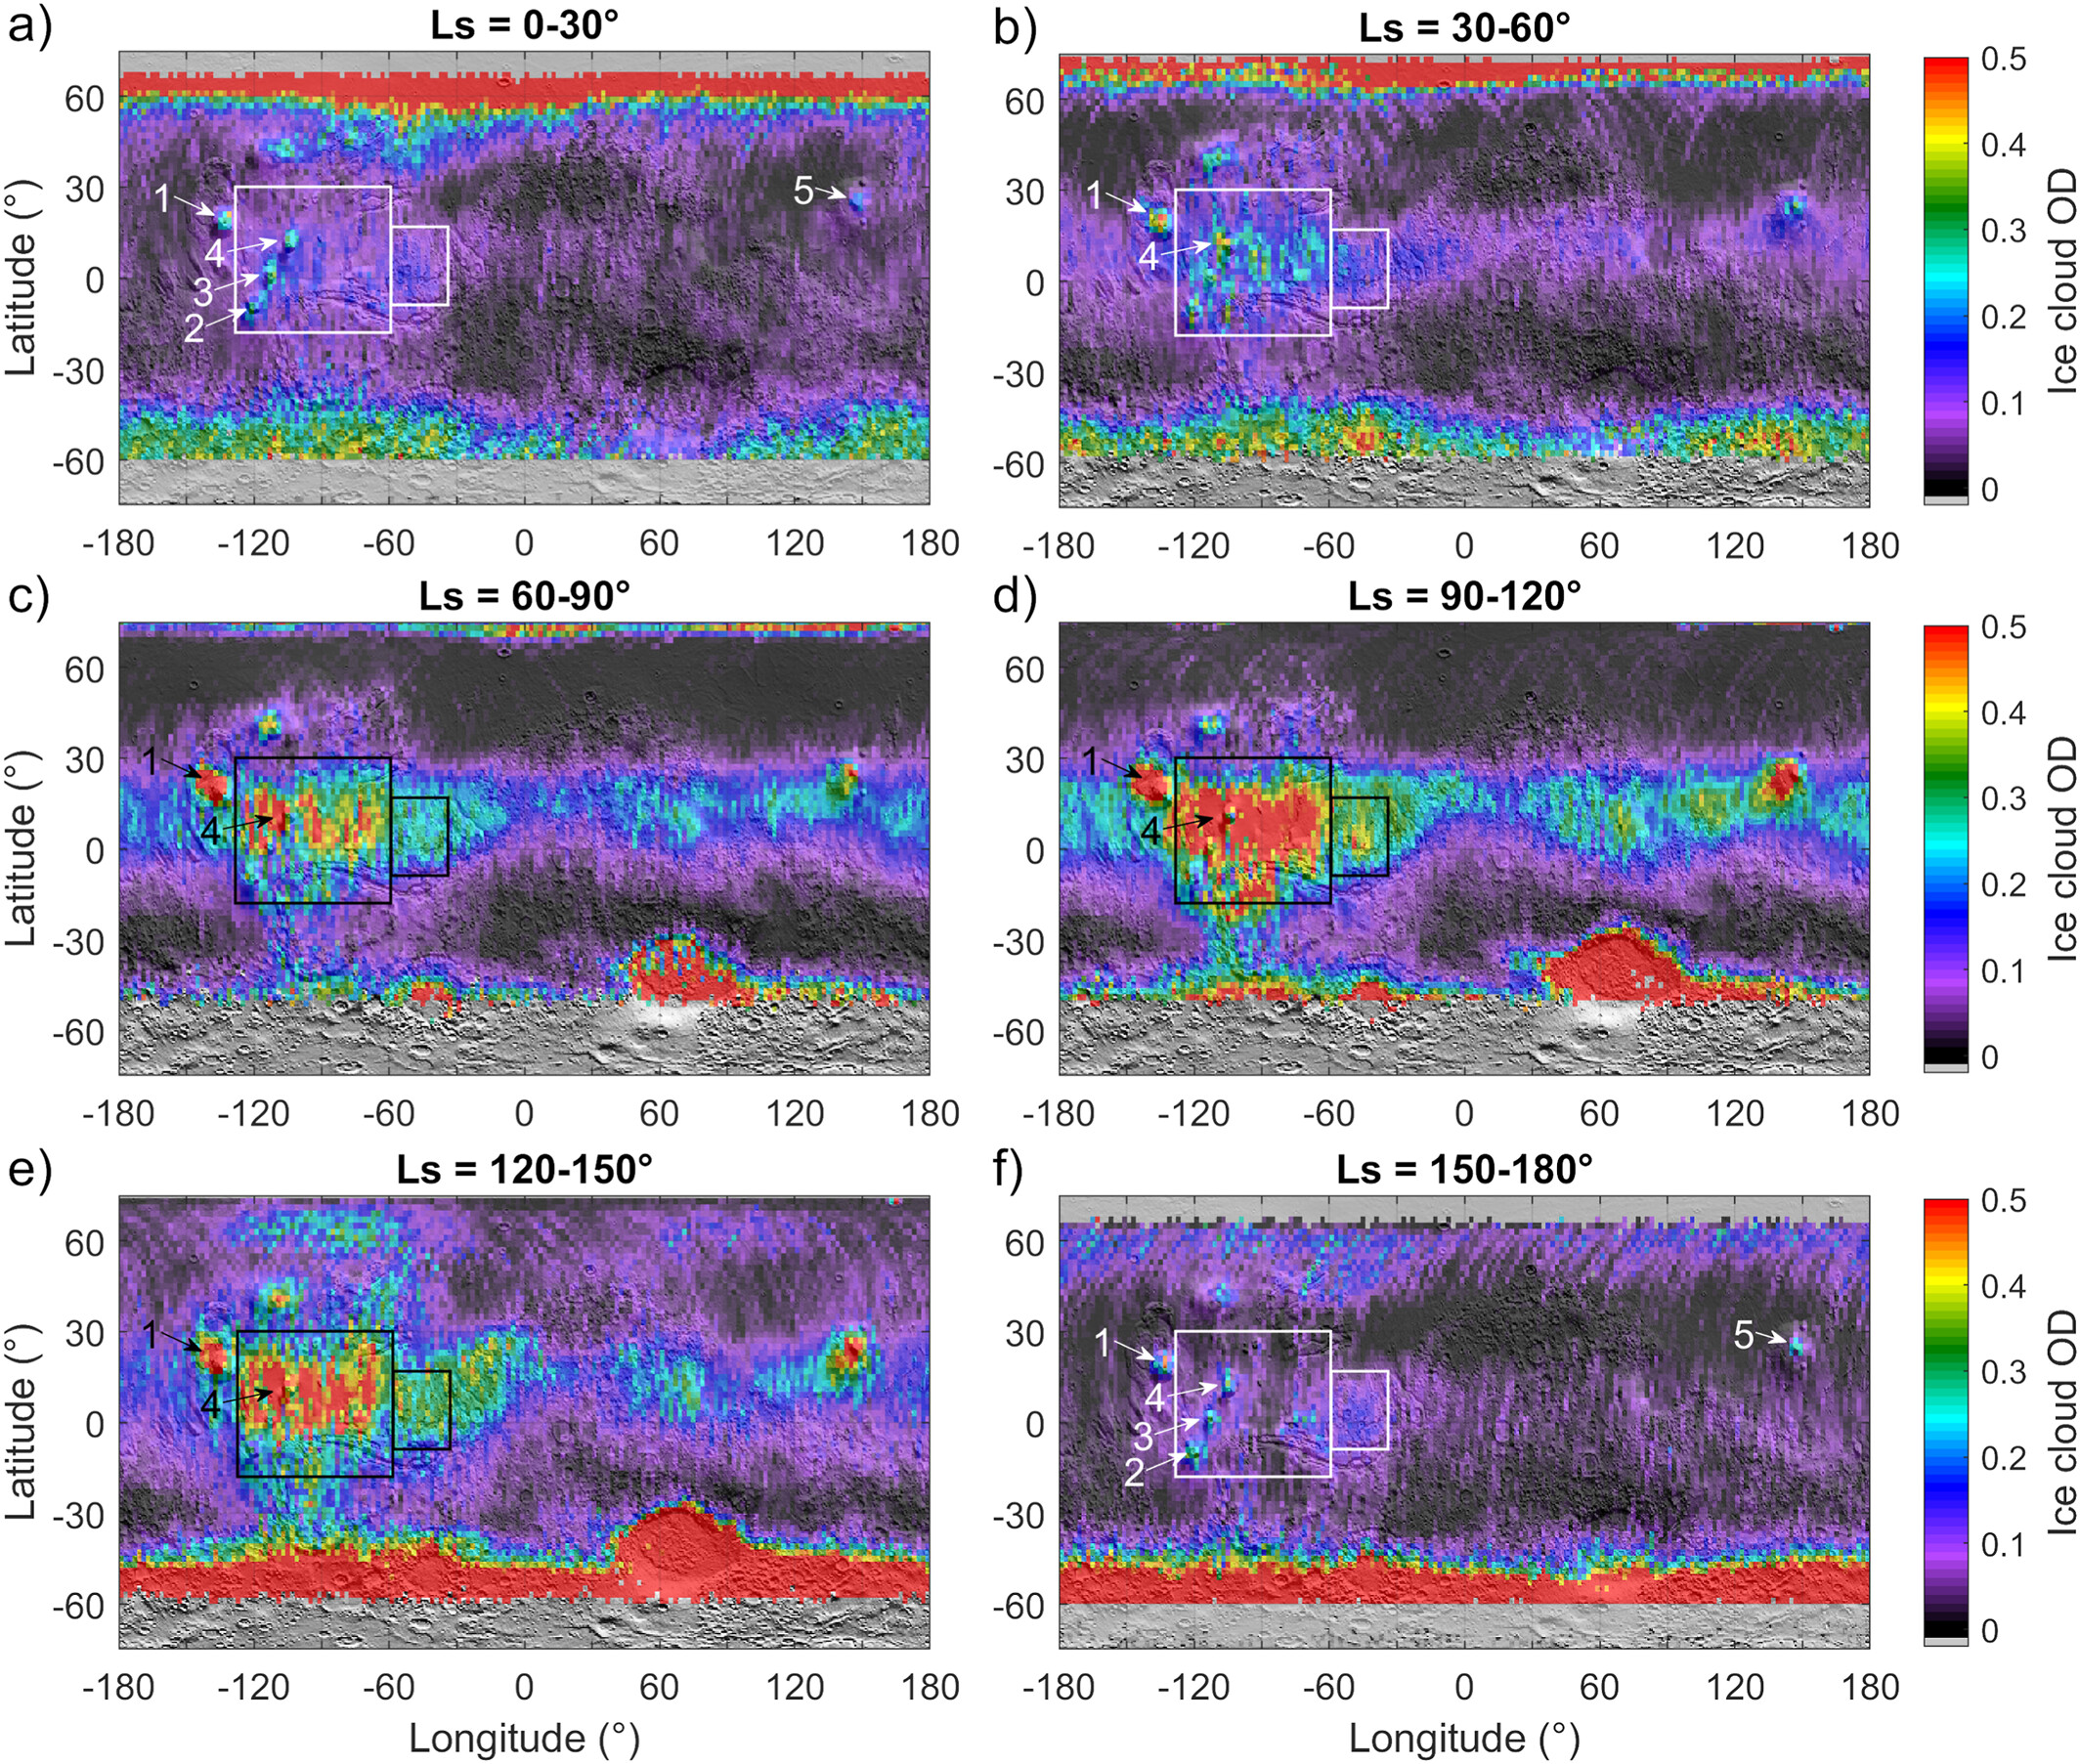
Spatial maps of the ice cloud OD for the first part of the Martian year (Ls = 0–180°) for six periods of 30° Ls (a–f). The maps were obtained by combining the data of MYs 35 to 38 contained in Figure 4 (and mixing all local times, cf. Figure 3b). These maps were obtained using the secondary retrieval mode, which derives ice cloud OD only, to include the cloudiness in Hellas. The retrieved difference between the primary (using 220–320 nm spectra) and the secondary (only 316 nm) remains generally limited (<±0.02)
JGR Planets (2026) https://doi.org/10.1029/2025JE009592
F. Hendrick, S. Robert, I. Thomas, S. Aoki, F. Daerden, L. Trompet, L. Neary, J. Erwin, Y. Willame, A. Piccialli, Z. Flimon, B. Ristic, M. R. Patel, G. Bellucci, M. A. López-Valverde, M. D. Smith, A. C. Vandaele
We present a new climatology of Martian water vapor column abundance derived from nadir dayside observations made by the Nadir and Occultation for MArs Discovery (NOMAD) instrument suite as part of the ExoMars Trace Gas Orbiter (TGO) mission. H2O vertical column densities are retrieved by applying an Optimal Estimation inversion scheme to the near-infrared reflectance factor spectra acquired by the NOMAD Limb, Nadir and Occultation (LNO) channel over Martian Years 34–38 (April 2018–June 2025). By correcting for saturated absorption lines and using an improved Acousto-Optical Tunable Filter (AOTF) calibration, H2O vertical columns retrieved from diffraction orders 167 and 169 quantitatively agree with co-located MGS/TES (Thermal Emission Spectrometer) and EMM/EMIRS (Emirates Mars Infrared Spectrometer) independent observations, in terms of seasonal and latitudinal variations. A good agreement is also obtained with the GEM-Mars General Circulation Model, except at high northern latitudes during the Aphelion season, where the current GEM-Mars version underestimates the H2O summer peak. The geographical distribution of the retrieved H2O column abundances is characterized over the different Martian seasons and shows the typical patterns observed by previous space-borne infrared instruments, such as the Pole-to-Pole transport and some local enhancements correlated with the topography. Our retrievals nevertheless indicate a more marked difference between Northern and Southern Hemisphere H2O column summer peaks. The seasonal cycle is also found to be stable from year-to-year, except during and after the Martian Year 34 global dust storm, where significantly smaller column abundances are observed compared to the same period in Martian Years 35–37.
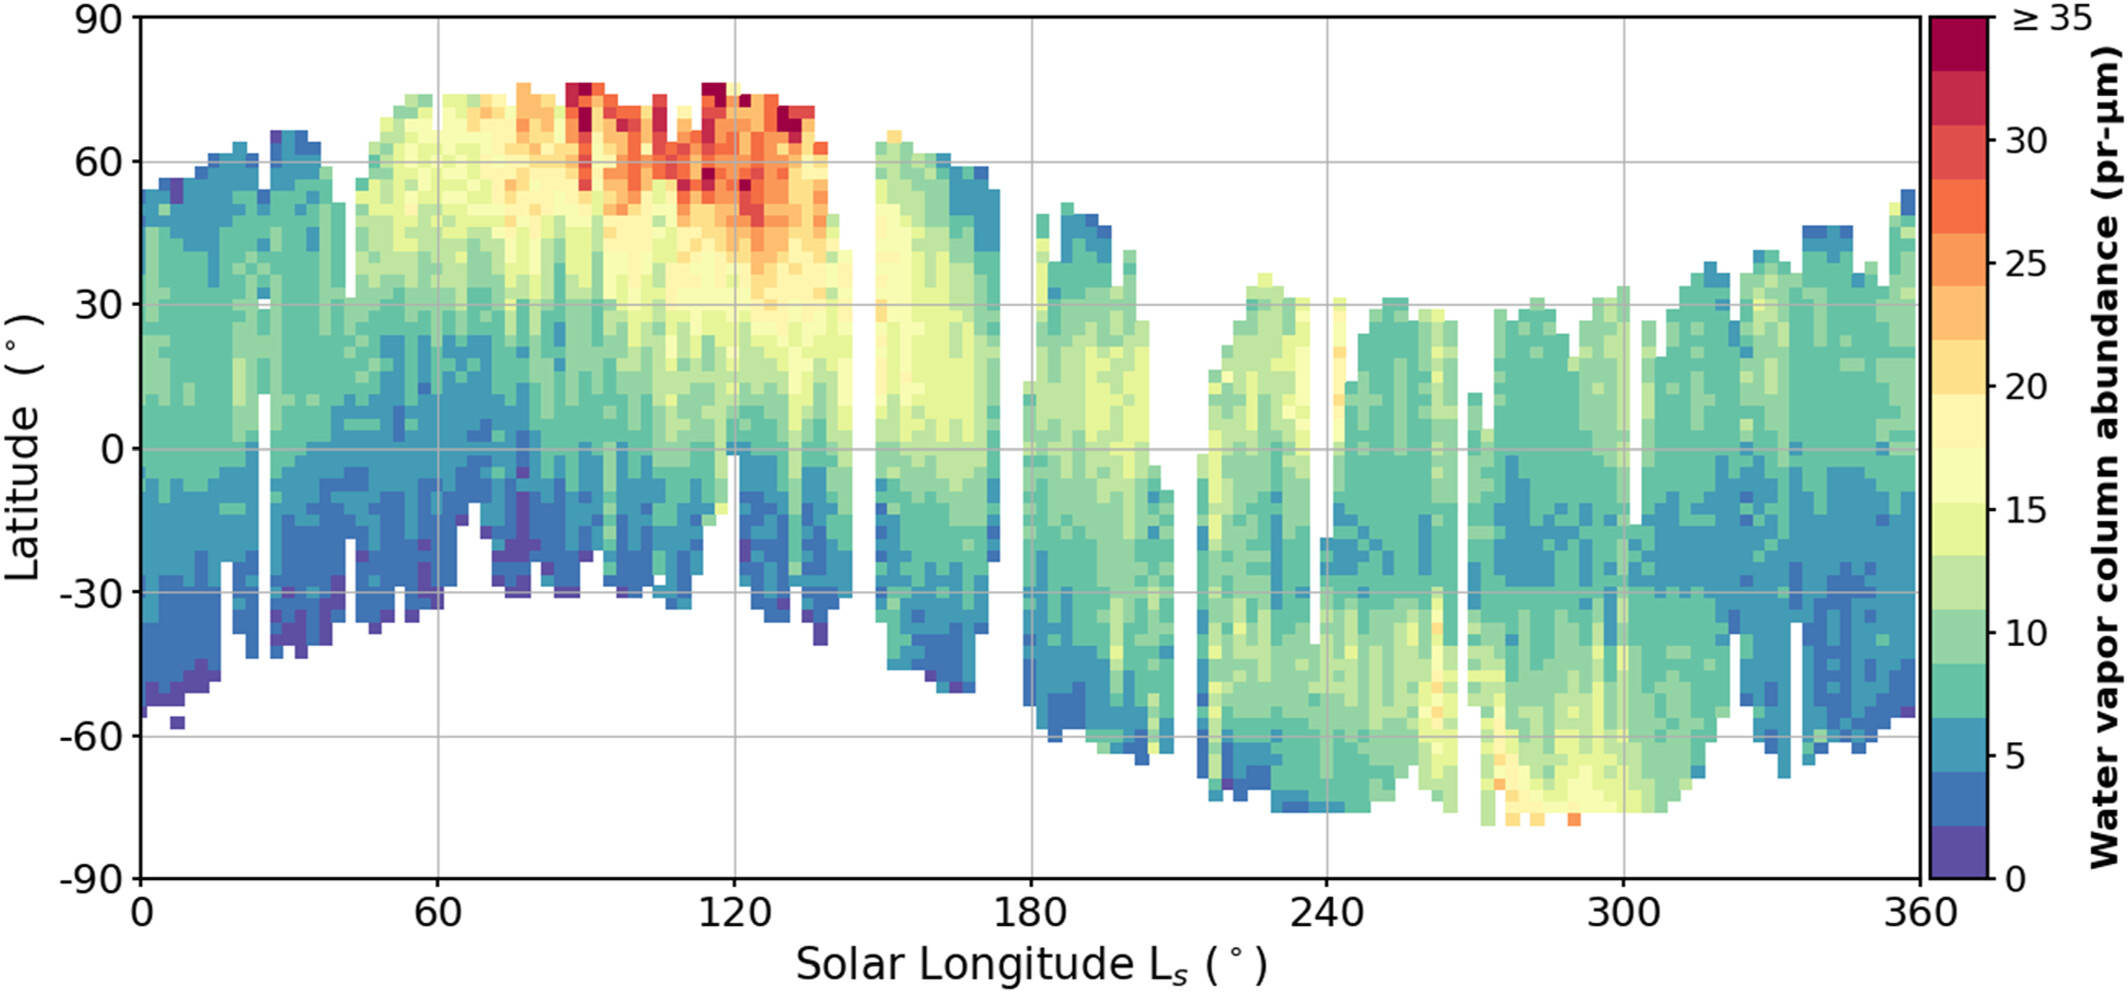
Seasonal variation as a function of the latitude of the LNO H2O column density averaged over the April 2018-June 2025 period (MY 34–38), excluding the MY 34 global dust storm most intense period (LS = 195°–230° range). Orders 167 and 169 columns are averaged in bins of 2.5° × 2.5° latitude and solar longitude. No correction for topography is applied here.
Astronomical Journal (2026) https://dx.doi.org/10.3847/1538-3881/ae3da7
Shohei Aoki, Yuka Fujii, Hideo Sagawa, Geronimo L. Villanueva, Ian Thomas, Bojan Ristic, Frank Daerden, Miguel Angel López-Valverde, Manish R. Patel, Jonathon Mason
Transit spectroscopy is a powerful tool for probing atmospheric structures of exoplanets. Accurately accounting for the effects of aerosols is key to reconstructing atmospheric properties from transit spectra, yet this remains a significant challenge. To advance this effort, it is invaluable to examine the spectral features of well-characterized planetary atmospheres. Here, we synthesize empirical transit spectra of Mars across different seasons based on data from the NOMAD’s Solar Occultation channel on board ExoMars/TGO, which operates at wavelengths of 0.2–0.65 and 2–4 μm. In the generated empirical transit spectra, the atmosphere below 25 km is found to be largely opaque due to the presence of micron-sized dust and H2O ice clouds, both of which substantially weaken spectral features. The spectra exhibit CO2 absorption features at 2.7–2.8 μm and signatures of submicron-sized mesospheric H2O ice clouds around 3.1 μm, accompanied by a continuum slope. The amplitudes of these spectral features are found to vary with the Martian seasons, where the dust storms weaken the CO2 signatures and strengthen the H2O ice features, which serve as potential indicators of a dusty planet like Mars. If TRAPPIST-1f possessed a Mars-like atmospheric structure, both CO2 and H2O ice features would be detectable at a noise level of 3 ppm, a level likely beyond current observational capabilities. Nevertheless, the 3.1 μm feature produced by submicron-sized mesospheric H2O ice clouds offers a novel avenue for characterizing the atmospheres of habitable-zone exoplanets.

Empirical transit spectra generated from the TGO/NOMAD solar occultation measurements taken at (a) northern summer (Ls = 30°–150°), (b) southern summer (Ls = 210°–340°), and (c) equinox (Ls = 340°–30°, 150°–210°). The color variation represents the latitudes of the measurements. The results obtained from the UVIS and infrared SO channels are shown in the left and right panels, respectively.
JGR Planets (2026) https://doi.org/10.1029/2025JE009191
A. Brines, M. A. López-Valverde, B. Funke, F. González-Galindo, S. Aoki, I. R. Thomas, G. L. Villanueva, G. Liuzzi, J. T. Erwin, U. Grabowski, F. Forget, J. J. Lopez-Moreno, J. Rodriguez-Gomez, F. Daerden, L. Trompet, B. Ristic, M. R. Patel, J. A. Holmes, G. Bellucci, A. Modak, A. C. Vandaele
This is the second part of an investigation of water vapor in the Martian atmosphere using solar occultation observations by the Nadir and Occultation for MArs Discovery (NOMAD) spectrometer on board the ExoMars Trace Gas Orbiter. Following the analysis of six Earth years of NOMAD observations performed in the first part, a cross-validation between NOMAD and ACS results is presented, showing global as well as profile-by-profile comparisons. The results reveal an overall good agreement between different teams and instruments, taking into account the different retrieval methodologies. In order to compare with model predictions, we perform an exhaustive analysis of the water vapor simulated by Mars Planetary Climate Model (MPCM). It shows that the MPCM reproduces most of the water vapor climatological features observed in the atmosphere. However, several discrepancies between model and observations are noticed. Some of these are possibly related to the vertical distribution of dust and its effect on the global circulation and on the water vapor vertical transport. Other data-model differences found at 60 km seem to be related to discrepancies on the water ice cloud formation in the MPCM. We include a cluster analysis of Martian water vapor vertical profiles for the first time. This technique applied to MPCM and NOMAD water vapor retrievals reveal distinct groups of profiles being representative of specific seasons and latitudinal regions, similarly distributed in both model and observations. Moreover, it allows us to provide a simplified water vapor climatology, useful to detect out-of-season events and biases in the retrieval processes.

Left panels show the seasonal-latitudinal distribution of the retrieved NOMAD SO water vapor vertical profiles for MYs 34, 35, 36 and 37 (from top to bottom respectively). Colors indicate the clusters where profiles were assigned. Right panel shows the representative water vapor VMR vertical profile (mean) of each cluster. Shaded regions show the standard deviation of each cluster.
JGR Planets (2026) https://doi.org/10.1029/2024JE008916
A. Brines, M. A. López-Valverde, B. Funke, F. González-Galindo, S. Aoki, I. R. Thomas, G. L. Villanueva, G. Liuzzi, J. T. Erwin, U. Grabowski, F. Forget, J. J. Lopez-Moreno, J. Rodriguez-Gomez, F. Daerden, L. Trompet, B. Ristic, M. R. Patel, J. A. Holmes, G. Bellucci, A. Modak, A. C. Vandaele
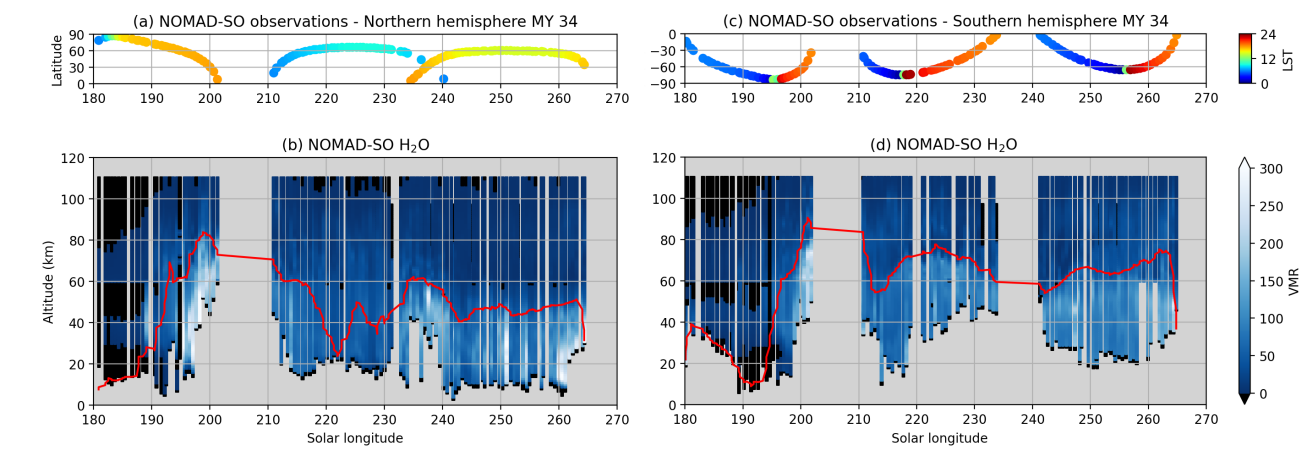
We present vertical profiles of water vapor obtained during six continuous years of solar occultation observations in the infrared by the Nadir and Occultation for MArs Discovery (NOMAD) instrument on board Trace Gas Orbiter. The retrievals have been performed with an inversion code previously applied to smaller samples of this data set, but improved to combine pairs of diffraction orders allowing for sounding water vapor up to about 120 km altitude. As a first part of a set of two papers, this study presents the most extended data set of water vapor measurements from the NOMAD instrument to date, covering three full and consecutive Martian Years. Building upon previous researches primarily focused on the perihelion season, this analysis now includes the aphelion season, offering a comprehensive view of Mars' water cycle. Observations from April 2018 to December 2023 were analyzed, covering perihelion of Mars Year (MY) 34 to aphelion of MY 37 and presenting water vapor vertical profiles from approximately 5–10 km to 110–120 km in altitude. This study reveals consistent seasonal and latitudinal water vapor patterns, showing water vapor systematically more vertically extended during the perihelion season than during the aphelion. We present an extensive analysis of the water vapor local time variability, confirming overall larger abundances during the evenings than during mornings. These data provide new insights into the vertical distribution of atmospheric water vapor on Mars, aiding future comparisons and global climate model validation.

Vertical distribution of water vapor volume mixing ratio (VMR) over solar longitude during mars years 34, 35, 36, and 37 for the Northern (c) and Southern (d) hemispheres. Notice that the water vapor abundance's color scale is not linear. Top panel indicates the Latitude and O VMR at 30 (a) and 80 (b) km altitude.
Nature Communications Earth & Environment (2026) https://doi.org/10.1038/s43247-025-03157-5
Adrián Brines, Shohei Aoki, Frank Daerden, Michael S. Chaffin, Samuel A. Atwood, Susarla Raghuram, Bruce A. Cantor, Yannick Willame, Loïc Trompet, Geronimo L. Villanueva, Michael J. Wolff, Michael D. Smith, Christopher S. Edwards, Ian R. Thomas, Giuliano Liuzzi, Lori Neary, Manish R. Patel, Miguel Angel López-Valverde, Armin Kleinböhl, Hoor AlMazmi, James Whiteway, AnnCarine Vandaele, Bojan Ristic & Giancarlo Bellucc
Mars almost certainly had a considerable amount of water in its past. Recent observations reveal that during southern summer, when the atmosphere is warmer and dustier, water vapor can reach high altitudes without condensing, leading to water loss to space. Here, by combining infrared, visible, and ultraviolet data from multiple Mars orbiters, we identify a new pathway for water loss, observed for the first time to our knowledge during the opposite season. Our findings show that a strong, localized, and short-lived dust storm in Martian Year 37 (August 2023) drove considerable vertical transport of water vapor in the northern summer season. Just days after the storm, enhanced water vapor concentrations were observed at altitudes over 40 km across northern high latitudes, followed by an increase in escaping hydrogen detected at the exobase. These results suggest that water loss on Mars can be triggered by strong local dust storms at any time of year.

Vertical distribution of water vapor volume mixing ratio (VMR) as a function of latitude (a1, a2) and solar longitude for the northern (b1,b2) and southern (c1,c2) hemispheres during MYs 35 (left) and MY 37 (right). Dots over each panel indicate the solar longitude, latitude and local time of the NOMAD observations. Blue and red dots indicate morning and evening observations, respectively.
Icarus Notes (2025) https://doi.org/10.1016/j.icarus.2025.116923
M. Escudero-Jiménez, M.A. López-Valverde, J. Peralta, T. Moya, A. Belmonte, A. Brines, I. Thomas, G. Villanueva, G. Liuzzi, E. Knutsen, S. Viscardy, F. González-Galindo, A. Modak, B. Funke, J.J. López-Moreno, J. Rodríguez, R. Sanz, F. Daerden, L. Trompet, A.S.J. Khayat, A.C. Vandaele

PNAS (2025) https://doi.org/10.1073/pnas.2511744122 https://orfeo.belnet.be/handle/internal/14418
Daniel Viúdez-Moreiras, Michael D. Smith, Mike Wolff, Megan A. J. Brown, Frank Daerden, María-Paz Zorzano, Víctor Apestigue, Ignacio Arruego, Elisa García, Juan J. Jiménez, Daniel Toledo, Mark T. Lemmon, Elise Wright Knutsen, and Alfonso Saiz-Lopez
Ozone plays a key role in both atmospheric and near-surface chemistry, as well as in UV absorption in planetary atmospheres. We report observations of ozone from the surface of another planet using the ozone detector aboard NASA’s Mars 2020 mission. Total column measurements acquired at Jezero Crater, together with previous space-based observations, indicate that most of the observed ozone is confined below 20 km of altitude, strongly differing from the typical ozone vertical profile in the Earth atmosphere. Also, these ozone levels below 20 km are several times higher than those predicted by models, challenging the current understanding of atmospheric chemistry and composition in the lower atmosphere of Mars.

Vertical column density (VCD) measurements of ozone at low zenith angles (<3°), acquired between mission sols 65 and 290 (~37° < Ls < ~139°) (northern spring and summer), as a function of LTST, totaling 116 photometric observations. The mean abundance is shown by a red dashed line. 1σ error bars are shown, dominated by systematic uncertainties (~2 μm-atm) which mainly come from absolute calibration of the instrument. The top panels show the expected O3 mixing ratio in both the UT (>20 km) and the near-surface in the tropical region, simulated by JPL/Caltech KINETICS model. Each layer contributes variable to the total column abundance throughout the day, expecting predominance in the Mars 2020 observations by the LT layer. The green shadowed area is the sampled diurnal timeslot by Mars 2020 (11 to 13 h LTST). The red arrows represent the timings where vertical profiles are retrieved by orbiters in the UT. Two groups are established, in accordance with Table 1 (35° < Ls < 90° and 110° < Ls < 140°) (black and red dots, respectively), observing a clear drop in column abundances in the second group of measurements.
JGR: Planets (2025) https://doi.org/10.1029/2025JE009105 https://orfeo.belnet.be/handle/internal/14417
Sara Faggi, Shohei Aoki, Giuliano Liuzzi, Geronimo Villanueva, Hideo Sagawa, Michael J. Mumma, Ann Carine Vandaele, Frank Daerden, Sébastien Viscardy
Hydrogen chloride (HCl) was recently discovered in the Mars atmosphere using the ESA's ExoMars Trace Gas Orbiter (TGO) onboard ESA's ExoMars mission. Its discovery is the first confirmation of an active presence of any chlorine-bearing species in the modern Mars atmosphere. TGO permitted investigations of HCl altitude profiles with high precision and showed that water vapor and ice clouds play an important role in the production and temporary loss of HCl. TGO cannot always sample the Martian atmosphere near the surface, and when those measurements are possible, they are highly affected by the increase in dust opacity, nor can TGO observe at equatorial latitudes with high cadence, due to orbital constraints, so its measurements are not suitable to obtain instantaneous global coverage. In this work, we present a methodic investigation of the Martian atmosphere, in support of the ExoMars TGO mission, targeting HCl and water using iSHELL at NASA/InfraRed Telescope Facility. Our observations mapped the Martian atmosphere, exploring three seasons in Martian Year 36. We observed the beginning of an increase in the HCl abundances around LS = 249°–301°, followed by a drop in the abundances around LS = 319°. We confirmed a strong correlation between the spatial distribution of water vapor and HCl—both globally and locally—suggesting that water vapor plays an important role in the production of HCl, in agreement with previous studies. Our observations also suggest the presence of two competing processes involving the dust, one supporting HCl production and another one contributing to its destruction.

Longitudinally weighted mean of Hydrogen chloride [ppb] (top panel), water vapor [ppm] (middle panel), and total atmospheric dust column optical depth (CDOD) across MY36. The bottom x‐axis shows the solar longitude Ls [°], while the
top x‐axis indicates the corresponding observed Ls seasons.
Icarus (2025) https://doi.org/10.1016/j.icarus.2025.116707
L. Soret, H. Robin, J.-C. Gérard, L. Gkouvelis, I. Thomas, B. Ristic, Y. Willame, B. Hubert, A.C. Vandaele, J.P. Mason, F. Daerden, M.R. Patel
The Ultraviolet and Visible Spectrometer (UVIS) instrument of the Nadir and Occultation for MArs Discovery (NOMAD) aboard the ExoMars Trace Gas Orbiter (TGO) observes the Martian dayglow at 557.7 nm, which corresponds to the oxygen green line emission. Soret et al. (2022) analyzed a full Martian year of dayside limb observations and implied that some variability could be observed in both the altitude and intensity of the green dayglow. In this work, we take advantage of three Martian years of observations to analyze the evolution of the peak brightness and peak altitude of the oxygen green line emission during a period of increasing solar activity. We show that the limb brightness can change by ∼70 % from one Martian year to the other. The green line brightness is highly correlated with both seasonal and solar activity effects. The brightest intensities of the oxygen green line occur near perihelion and when solar insolation is highest. However, we observe that the peak altitude is highly correlated with season (maximum at perihelion) but it does not show a dependence on solar activity. Finally, we compare the evolution of the green line peak altitude with that of the 0.39-μbar pressure level provided by the Mars Climate Database (MCD) v6.1 and show that the calculated CO2 density can be overestimated by up to a factor of 2, especially in the northern hemisphere. We conclude that dayside observations of the green line emission are a powerful tool to constrain global circulation models and remotely monitor the dynamics of the Mars atmosphere over time and season in the 70–100 km region.

a) The green line peak brightness (black) and the Ly-α irradiance (blue) are represented over time. Martian years are indicated with vertical dashed lines. b) Correlation between the green line peak brightness and the Ly-α irradiance. c and d) Both the 557.7-nm peak brightness and solar Ly-α irradiance have been corrected from the Sun-Mars distance (1/r2). Brightness uncertainties (in very light gray) are based on the 1-σ deviation of the background noise in the neighborhood of the emission, similarly to Soret et al., 2022, Soret et al., 2023. Altitude uncertainties are estimated with the vertical sampling resolution. (For interpretation of the references to color in this figure legend, the reader is referred to the web version of this article.)
JGR (2025) https://doi.org/10.1029/2024JE008303
Z. Flimon, J. Erwin, S. Robert, L. Neary, A. Piccialli, L. Trompet, Y. Willame, F. Vanhellemont, F. Daerden, S. Bauduin, M. Wolff, I. R. Thomas, B. Ristic, J. P. Mason, C. Depiesse, M. R. Patel, G. Bellucci, J.-J. Lopez-Moreno, A. C. Vandaele
The Nadir and Occultation for MArs Discovery spectrometer on board Trace Gas Orbiter began science operations in April 2018, providing infrared and ultraviolet-visible spectra of the Martian atmosphere. This paper explores the application of the UVIS channel in solar occultation to study aerosols. We have developed a retrieval scheme that allows us to study the size and extinction of the aerosol as a function of altitude. Results from mid-MY 34 to the end of MY 36 are reported and discussed. Particle size is retrieved using a Mie code with log-normal distribution with an effective radius (reff), 0.1–0.8 μm and an effective variance (veff) equal 0.1. In this work, we show the presence of aerosol-detached layers, characterized by a local increase in particle size and extinction. These detached layers can be composed of dust, H2O ice, or CO2 ice. CO2 ice clouds can be detected up to 80 km, while H2O ice clouds are usually more present around 30–50 km. Symmetry of the particle effective radius between the northern and southern regions is observed. During northern/southern winter, the atmospheric aerosols are composed of smaller particles below 0.6 μm but in summer, the size increases to micron-sized particles that are larger than the sensitivity of UVIS. This increase in size in the northern/southern summer is not correlated with a similar increase in extinction. Our data support the previously observed relationship between water vapor and aerosol, especially the formation of high-altitude water ice cloud during the global dust storm event.

Same as Figure 3 but for the retrieved particle size reff (of all aerosols together). The particle sizes are larger during perihelion than aphelion, which is explained by dust activity. In aphelion, detached layers of large particles are observed. The large increases in size indicate the presence of a dust storm as seen during the GDS in MY34 and around Ls 330° in all MY.
GRL (2025) https://agupubs.onlinelibrary.wiley.com/doi/full/10.1029/2024GL111745
Aadarsh Raj Sharma, Lot Ram, Harshaa Suhaag, Dipjyoti Patgiri, Lauriane Soret, Jean-Claude Gérard, Ian R. Thomas, Ann Carine Vandaele, Sumanta Sarkhel
We report, for the first time, the impact of interplanetary coronal mass ejections (ICME) on the recently discovered O(1S) 557.7 nm dayglow emission in the Martian atmosphere. While there are a few studies on the seasonal variation of 557.7 nm dayglow emission available in the literature, the impact of ICME has not been investigated so far. Using the instruments aboard the ExoMars-TGO and Mars Atmosphere and Volatile Evolution (MAVEN) spacecraft, we show that the primary emission peak (75–80 km) remains unaffected during ICME events compared to quiet-times. However, an enhancement has been observed in the brightness of the secondary emission peak (110–120 km) and the upper altitude region (140–180 km). The enhancement is attributed to the increased solar electrons, X-ray fluxes and Solar Energetic Particles, augmenting the electron-impact processes causing the enhancement in the brightness. Thus, this study has an implication to the brightness of Martian upper atmosphere during intense solar transients like ICME.

Radiance limb profile of 557.7 nm emission during event-time (red), quiet-time (blue), and average-quiet-time (gray). Gray zone is 1σ variability. Red and blue horizontal bars are 10% error in the brightness.
JGR (2024) https://doi.org/10.1029/2024JE008620
L. Soret, F. González-Galindo, J.-C. Gérard, I. R. Thomas, B. Ristic, Y. Willame, A. C. Vandaele, B. Hubert, F. Lefèvre, F. Daerden, M. R. Patel
The Mars NO and the O2 nightglow are produced by the recombination of atoms produced on the dayside by photodissociation and transported to the nightside. These emissions are tracers of the summer to winter pole dynamics in the upper Mars atmosphere. The UV-visible (UVIS) channel of the Nadir and Occultation for MArs Discovery (NOMAD) spectrometer onboard Trace Gas Orbiter (TGO) is the first instrument able to simultaneously monitor both nightglow emissions. Observations by NOMAD/UVIS during the first part of the Martian year show that both the NO and O2 nightglow emissions are enhanced near the southern winter pole. Their mean brightnesses are 15 and 108 kR, respectively. These nightglow emissions generally occur between 30 and 60 km, the NO emitting layer being consistently located ∼10 km higher than the O2 nightglow layer. Numerical simulations with the Mars Planetary Climate Model (MPCM, v6.1) properly reproduce the nightglow brightness but tend to overestimate the NO peak altitude by ∼10 km. These results suggest that the atomic oxygen density is correctly predicted by the model but that the nitrogen density altitude distribution might not be properly modeled.

Dots represent NOMAD/UVIS observations. Colored lines represent model simulations with red for O2 and blue for NO. Gray dots represent upper limit brightnesses in cases of non-detections. Simulations were performed at the indicated coordinates corresponding to the average coordinates of the O2 and NO peak acquisition.
Icarus (2024) https://doi.org/10.1016/j.icarus.2024.116401
B. Hubert , L. Soret, J.-C. Gérard, G. Wautelet, G. Munhoven, A. Piccialli, and A. C. Vandaele
Over the last two decades, important efforts have been undertaken by the most prominent space agencies to explore and analyze the interior, ground and atmosphere of Mars. A series of remote sensing instruments have been deployed and operated to characterize the atmospheric composition and dynamics. Several techniques have been used including solar occultation spectroscopy recording the sun spectrum attenuated through the atmosphere. We present three different methods dedicated to the analysis of occultation observations in the ultraviolet (UV) wavelength range covering the Hartley band of ozone. These methods are designed to account for several absorbing gases as well as aerosols responsible for extinction along the observing line-of-sight passing through the atmosphere. The aerosols are described using a local extinction parameter at a reference wavelength and a so-called Angström α-parameter to express the wavelength dependency of extinction with a power law.
In a first method, inverse Abel transform of the total extinction parameter (or optical thickness) of the atmosphere is conducted at each wavelength using a least-squares fitting technique, followed by a second least squares estimate of the local atmospheric properties at all fitting altitudes, separately.
A second method is derived in which all the atmospheric gas concentrations and aerosol extinction coefficient at reference wavelength vary with altitude in a piecewise linear manner. The α parameter is however assumed to be a piecewise linear function of ln(r), allowing for numerical and analytic developments. For the sake of inversion of the observation, the gas densities and aerosol reference extinction parameters are expressed as a function of the α parameters using a linear least-squares fitting expression, so that the α parameters can be estimated using a non-linear least-squares fitting method.
A third method is derived in which the gas species are approximated using piecewise exponential branches. Tests are conducted to evaluate the efficiency of all methods against retrieval of a prescribed atmospheric profile.
It is found that the first two methods can readily retrieve the atmospheric properties, the second one allowing for more consistent uncertainty estimates. The third method is found to be computationally expensive with a difficult-to-reach fitting convergence. Preliminary tests are conducted using TGO-NOMAD-UVIS observations in the O3 Hartley band wavelength range. It is found that the CO2 extinction is too weak to allow retrieval of the CO2 density profile from observations at those wavelengths, while the O3 density and dust properties can be successfully retrieved.

Synthesis of inversions of 1000 simulated noisy occultation profiles. The dotted lines represent the input (noise-free) profiles to be retrieved. The black dashed lines represent the average of the 1000 retrievals. The red and blue dashed lines bracketing the black one show the ±1-σ interval of the retrieved distribution.
GRL (2024) https://doi.org/10.1029/2023GL107224
A. Brines, M. A. López-Valverde, B. Funke, F. González-Galindo, S. Aoki, G. L. Villanueva, J. A. Holmes, D. A. Belyaev, G. Liuzzi, I. R. Thomas, J. T. Erwin, U. Grabowski, F. Forget, J. J. Lopez-Moreno, J. Rodriguez-Gomez, F. Daerden, L. Trompet, B. Ristic, M. R. Patel, G. Bellucci, A. C. Vandaele
Here we present water vapor vertical profiles observed with the ExoMars Trace Gas Orbiter/Nadir and Occultation for MArs Discovery instrument during the perihelion and Southern summer solstice season (LS = 240°–300°) in three consecutive Martian Years 34, 35, and 36. We show the detailed latitudinal distribution of H2O at tangent altitudes from 10 to 120 km, revealing a vertical plume at 60°S–50°S injecting H2O upward, reaching abundance of about 50 ppmv at 100 km. We have observed this event repeatedly in the three Martian years analyzed, appearing at LS = 260°–280° and showing inter-annual variations in the magnitude and timing due to long term effects of the Martian Year 34 Global Dust Storm. We provide a rough estimate of projected hydrogen escape of 3.2 × 109 cm−2 s−1 associated to these plumes, adding further evidence of the key role played by the perihelion season in the long term evolution of the planet's climate.

Water vapor latitudinal variation during Ls1 = 240°–260° (a1, b1, c1), Ls2 = 260°–280° (a2, b2, c2), and Ls3 = 280°–300° (a3, b3, c3) for Martian Years (MYs) 34 (left), 35 (middle), and 36 (right). Lines show VMR contours at 100 (black), 50 (gray), and 20 (white) ppmv. Dots in panels a1–a3, b1–b3, c1–c3 indicate the latitude, Solar Longitude, and Local Solar Time of the observations. Panel (d) shows the seasonal variation of water vapor number density (cm−3) in the southern hemisphere at 100 km for Ls = 240°–300° during MYs 34 (blue), 35 (orange), and 36 (green). Vertical dashed line indicates the peak of the plume observed at 100 km during MYs 35 and 36 at Ls = 268°. Solid lines show the seasonal average. Panel (e) shows the latitude of the analyzed Nadir and Occultation for MArs Discovery Solar occultation observations over solar longitude for MYs 34 (blue), 35 (orange), and 36 (green). Horizontal dashed line indicates the equator. In panels (d) and (e), morning and evening terminator occultations are indicated with circles and triangles respectively.
JGR Planets (2024) https://doi.org/10.1029/2024JE008302
M. A. J. Brown, M. R. Patel, S. R. Lewis, J. A. Holmes, F. Lefèvre, J. P. Mason, M. Crismani
Ozone simulated in Mars Global Climate Models (MGCMs) is used to assess the underlying chemistry occurring in the atmosphere. Currently, ozone total column abundance (TCA) is under-predicted in MGCMs by up to 120%, implying missing or inaccurate chemistry in models. Heterogeneous reactions of hydroxyl radicals (HOX) have been offered as an explanation for some of this bias, because they cause ozone to increase at locations where it's currently under-predicted. We use four simulations to compare modeled ozone TCA with observations from the UVIS spectrometer aboard the ExoMars Trace Gas Orbiter to improve the representation of heterogeneous processes and their impact on ozone. We use a gas-phase only run, a dissociative scheme, an adsorbed HOX retention scheme, and a hybrid scheme that combines the dissociative mechanism with the retention of HOX on water ice. We find retention of HOX is dependent on water ice sublimation, and ozone abundance increases when water ice persists for longer periods (1–20 sols). Over time, the loss of HOX causes a depletion in H2O2 concentration (HOX reservoir), and thus allows ozone concentration to increase. When adsorbed HOX are desorbed and dissociate into other by-products, HOX are not immediately available to destroy ozone. This results in larger ozone concentrations than if desorbed HOX are released directly back into their gaseous states. When using the hybrid scheme, ozone TCA is increased up to 50% where the ozone deficit is greatest, demonstrating the best agreement with observations, and implying that HOX radicals are both retained when adsorbed and dissociate.

First column shows the zonally averaged vertical profiles of (top) ozone, (middle) HOX (OH and HO2), and (bottom), H2O2. Other columns show the percentage difference between the control and (second column) 100% release scheme, (third column) 0% release scheme, and (fourth column) 50% release scheme of the respectively chemical species. Difference is calculated by heterogeneous divided by control, multiplied by 100. Contour lines show the abundance of that species from that simulation. Simulations are for LS = 5°–10°, MY 35.
Nature Geoscience (2024) https://doi.org/10.1038/s41561-024-01457-7
A. Valantinas, N. Thomas, A. Pommerol, O. Karatekin, L. Ruiz Lozano, C. B. Senel, O. Temel, E. Hauber, D. Tirsch, V. T. Bickel, G. Munaretto, M. Pajola, F. Oliva, F. Schmidt, I. Thomas, A. S. McEwen, M. Almeida, M. Read, V. G. Rangarajan, M. R. El-Maarry, C. Re, F. G. Carrozzo, E. D’Aversa, F. Daerden, B. Ristic, M. R. Patel, G. Bellucci, J. J. Lopez-Moreno, A. C. Vandaele & G. Cremonese
The present-day water cycle on Mars has implications for habitability and future human exploration. Water ice clouds and water vapour have been detected above the Tharsis volcanic province, suggesting the active exchange of water between regolith and atmosphere. Here we report observational evidence for extensive transient morning frost deposits on the calderas of the Tharsis volcanoes (Olympus, Arsia and Ascraeus Montes, and Ceraunius Tholus) using high-resolution colour images from the Colour and Stereo Surface Imaging System on board the European Space Agency’s Trace Gas Orbiter. The transient bluish deposits appear on the caldera floor and rim in the morning during the colder Martian seasons but are not present by afternoon. The presence of water frost is supported by spectral observations, as well as independent imagery from the European Space Agency’s Mars Express orbiter. Climate model simulations further suggest that early-morning surface temperatures at the high altitudes of the volcano calderas are sufficiently low to support the daily condensation of water—but not CO2—frost. Given the unlikely seasonal nature of volcanic outgassing, we suggest the observed frost is atmospheric in origin, implying the role of microclimate in local frost formation and a contribution to the broader Mars water cycle.

a, Global view of Mars with white box marking the location of Olympus Mons. b, HRSC wide-angle image of Olympus Mons acquired in the early morning (LST = 7:20, Ls = 346.7°, latitude = 18.2° N, longitude = −133.2° E). The black dashed line indicates the orbit of the TGO corresponding to the images in d and e. The white box highlights the close up in c. c, Zoomed-in view of the Olympus Mons caldera. The white and blue dashed rectangles show the footprints of the CaSSIS and NOMAD-LNO observations, respectively. d, High-resolution (4.5 m pixel–1) CaSSIS colour image of frost on the caldera floor and northern rim of Olympus Mons (LST = 7:11, Ls = 344.1°). Frost is absent on the well-lit steep slopes. The blue rectangle marks the footprint of the one NOMAD-LNO observation that falls within the frost-covered area. e, NOMAD-LNO channel observation of the Olympus Mons caldera. The ice index values indicate the presence of frost over the caldera floor (>µ + 3σ). The coloured areas on the plot indicate the confidence intervals. HRSC image ID: hn889_0000 (b,c). CaSSIS colour image ID: MY36_022332_162_0_NPB (d). NOMAD-LNO observation ID: 20221125_082524 (e). Credit: b, ESA/DLR/FU Berlin; d, ESA/TGO/CaSSIS under a Creative Commons license CC-BY-SA 3.0 IGO.
Icarus (2024) https://doi.org/10.1016/j.icarus.2024.116121
Giuliano Liuzzi, Geronimo L. Villanueva, Shohei Aoki, Shane W. Stone, Sara Faggi, Loïc Trompet, Lori Neary, Frank Daerden, Sébastien Viscardy, Guido Masiello, Carmine Serio, Ian R. Thomas, Manish R. Patel, Giancarlo Bellucci, Jose-Juan Lopez-Moreno, Bojan Ristic, Ann Carine Vandaele
We present here vertically resolved measurements of the carbon isotopic composition of CO2 in the Martian atmosphere between the surface and 50 km of altitude. The results are based on data taken by the ExoMars Trace Gas Orbiter with the NOMAD instrument and have been aggregated to derive an average vertical profile of 13C/12C. We find no seasonal or spatial trends with variabilities beyond the sensitivity of the measurements. For the analysis, we developed a method that allows us to estimate whether the observed variability of isotopic measurements is beyond their intrinsic accuracy, by exploiting ab-initio spectroscopy and the radiometric noise of the instrument. Applying this method to our data, we find that atmospheric CO2 is depleted in 13C compared to the Earth standard by 30‰ to 45‰, in line with previous ground-based measurements values of the atmosphere and in contrast with the average value obtained by Curiosity at the surface (46 ± 4‰). These differences in isotopic signatures of CO2 as measured across the atmosphere and near-surface pose new questions when inferring the evolution and history of carbon on Mars, and suggest that processes such as a strong atmosphere-surface interactions may be fractionating the carbon reservoirs on the planet.

A: Single retrievals color-coded by the average SNR of spectral lines in orders 141, 145 and 146. It also shows the 3-σ uncertainty at all altitudes from 5 to 55 km retrieved from the SPEX method (dashed lines). The plot also shows the average profile (black solid line) computed by weighted average of the retrievals in bins of 5 km, together with its uncertainty (grey area). B: histograms of the distribution of retrieved 13C/12C ratios in different altitude intervals with their standard deviation. The vertical lines represent the medians (solid) and the means (dashed). The grey histogram represents the values at 55–70 km, and the average is not reported given the high dispersion of the points. C: retrievals of synthetic spectra with 10 different noise realizations simulated using the VPDB standard for 3 different temperature biases. Note: all panels have the isotopic ratio with respect to the VPDB standard on the x-axis.
JGR Planets (2024) https://doi.org/10.1029/2023JE008270
J. P. Mason, M. R. Patel, J. A. Holmes, M. J. Wolff, J. Alday, P. Streeter, K. S. Olsen, M. A. J. Brown, G. Sellers, C. Marriner, Y. Willame, I. Thomas, B. Ristic, F. Daerden, A. C. Vandaele, J.-J. Lopez-Moreno, G. Bellucci
The distribution of Mars ozone (O3) is well established; however, our knowledge on the dayside diurnal variation of O3 is limited. We present measurements of Mars O3 column abundances, spanning Mars Year (MY) 34 to the end of MY 36, by the Ultraviolet and VIsible Spectrometer (UVIS), part of the Nadir and Occultation for MArs Discovery (NOMAD) instrument, aboard the ExoMars Trace Gas Orbiter. UVIS provides the capability to measure dayside diurnal variations of O3 and for the first time, a characterization of the dayside diurnal variations of O3 is attempted. The observed O3 climatology for Mars Years (MY) 34–36 follows the established seasonal trends observed through previous O3 measurements. At aphelion, the equatorial O3 distribution is observed to be strongly correlated with the water ice distribution. We show that the early dust storm in MY 35 resulted in a near-global reduction in O3 during northern spring and the O3 abundances remained 14% lower in northern summer compared to MY36. Strong latitudinal and longitudinal variation was observed in the diurnal behavior of O3 around the northern summer solstice. In areas with a weak O3 upper layer, O3 column abundance peaks in the mid-morning, driven by changes in the near-surface O3 layer. In regions with greater O3 column abundances, O3 is observed to gradually increase throughout the day. This is consistent with the expected diurnal trend of O3 above the hygropause and suggests that in these areas an upper O3 layer persists throughout the Martian day.

The zonally averaged column abundances of O3 as a function of Ls and latitude for MY 34 (LS = 150°–360°) top panel, MY 35 middle panel and MY 36 bottom panel. Only observations with a solar zenith angle <70° are shown and we have blacked out time periods that contain false ozone detections as a result of high dust loading.
Remote Sensing (2023) https://www.mdpi.com/2602016
Fabrizio Oliva, Emiliano D’Aversa, Giancarlo Bellucci, Filippo Giacomo Carrozzo, Luca Ruiz Lozano, Özgür Karatekin, Frank Daerden, Ian R. Thomas, Bojan Ristic, Manish R. Patel, José Juan Lopez-Moreno, Ann Carine Vandaele, Giuseppe Sindoni
NOMAD is a suite of spectrometers on the board of the ESA-Roscosmos Trace Gas Orbiter (TGO) spacecraft and is capable of investigating the Martian environment at very high spectral resolution in the ultraviolet–visible and infrared spectral ranges by means of three separate channels: UVIS (0.2–0.65 μm), LNO (2.2–3.8 μm), and SO (2.3–4.3 μm). Among all channels, LNO is the only one operating at infrared wavelengths in nadir-viewing geometry, providing information on the whole atmospheric column and on the surface. Unfortunately, the LNO data are characterized by an overall low level of signal-to-noise ratio (SNR), limiting their contribution to the scientific objectives of the TGO mission. In this study, we assess the possibility of enhancing LNO nadir data SNR by applying the Minimum Noise Fraction (MNF), a well-known algorithm based on the Principal Components technique that has the advantage of providing transform eigenvalues ordered with increasing noise. We set up a benchmark process on an ensemble of synthetic spectra in order to optimize the algorithm specifically for LNO datasets. We verify that this optimization is limited by the presence of spectral artifacts introduced by the MNF itself, and the maximum achievable SNR is dependent on the scientific purpose of the analysis. MNF application study cases are provided to LNO data subsets in the ranges 2.627–2.648 μm and 2.335–2.353 μm (spectral orders 168 and 189, respectively) covering absorption features of gaseous H2O and CO and CO2 ice, achieving a substantial enhancement in the quality of the observations, whose SNR increases up to a factor of 10. While such an enhancement is still not enough to enable the investigation of spectral features of faint trace gases (in any case featured in orders whose spectral calibration is not fully reliable, hence preventing the application of the MNF), interesting perspectives for improving retrieval of both atmospheric and surface features from LNO nadir data are implied.
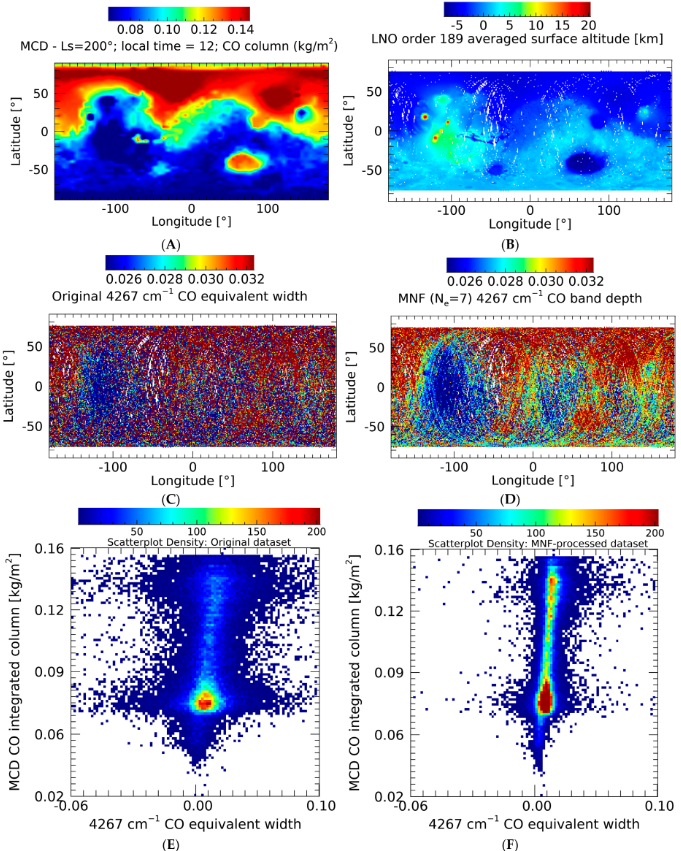
(A) MCD simulation of the CO-integrated column in kg/m2. (B) LNO order 189 data averaged surface altimetry in km (from MOLA data, [37]). (C) Equivalent width of the CO 4267 cm−1 absorption line computed on LNO order 189 original data. (D) Equivalent width of the CO 4267 cm−1 absorption line computed on the MNF-processed data (Ne = 7). (E) Density scatter plot of the quantities in panels (A,C). (F) As in panel (E), but here the quantities in panels (A,D) are being compared.
JGR (2023) https://doi.org/10.1029/2023JE008002
J. P. Mason, M. R. Patel, M. Pajola, E. D. Cloutis, J. Alday, K. S. Olsen, C. Marriner, J. A. Holmes, G. Sellers, N. Thomas, M. Almeida, M. Read, H. Nakagawa, I. R. Thomas, B. Ristic, Y. Willame, C. Depiesse, F. Daerden, A. C. Vandaele, J. J. Lopez-Moreno, G. Bellucci
Spectroscopic measurements are a powerful tool to investigate the surface composition of airless bodies and provide clues of their origin. The composition and origin of Phobos and Deimos are still unknown and are currently widely debated. We present spectroscopic measurements of Phobos and Deimos at ultraviolet and visible wavelengths (250–650 nm) made by the NOMAD-Ultraviolet and Visible Spectrometer (UVIS) on the ExoMars TGO mission. These new spectra cover multiple areas on Phobos and Deimos, and are of generally higher spectral resolution and signal-to-noise than previous spectra, and extend to lower wavelengths than most previous measurements. The UVIS spectra confirm a red-sloped spectrum lacking any strong absorption features; however, we confirm the presence of a previously identified absorption feature near 0.65 μm and tentative absorption near 0.45 μm. The observed Phobos and Deimos spectra are similar to D- and T-type asteroids, adding weight to the captured asteroid hypothesis for the moons' origins. We also find, however, that the UVIS Phobos reflectance spectra of Phobos' red unit is a relatively close match to the olivine-rich, highly shocked Mars meteorite NWA 2737, with a low overall reflectance, a red-sloped spectrum, and lack of olivine-associated absorption bands in the UVIS spectral range. This meteorite, however, exhibits spectral features at longer wavelengths that not observed in the Martian moon spectra, indicating a need for further investigation at longer wavelengths to interpret whether this material could inform our understanding of Phobos' origin.
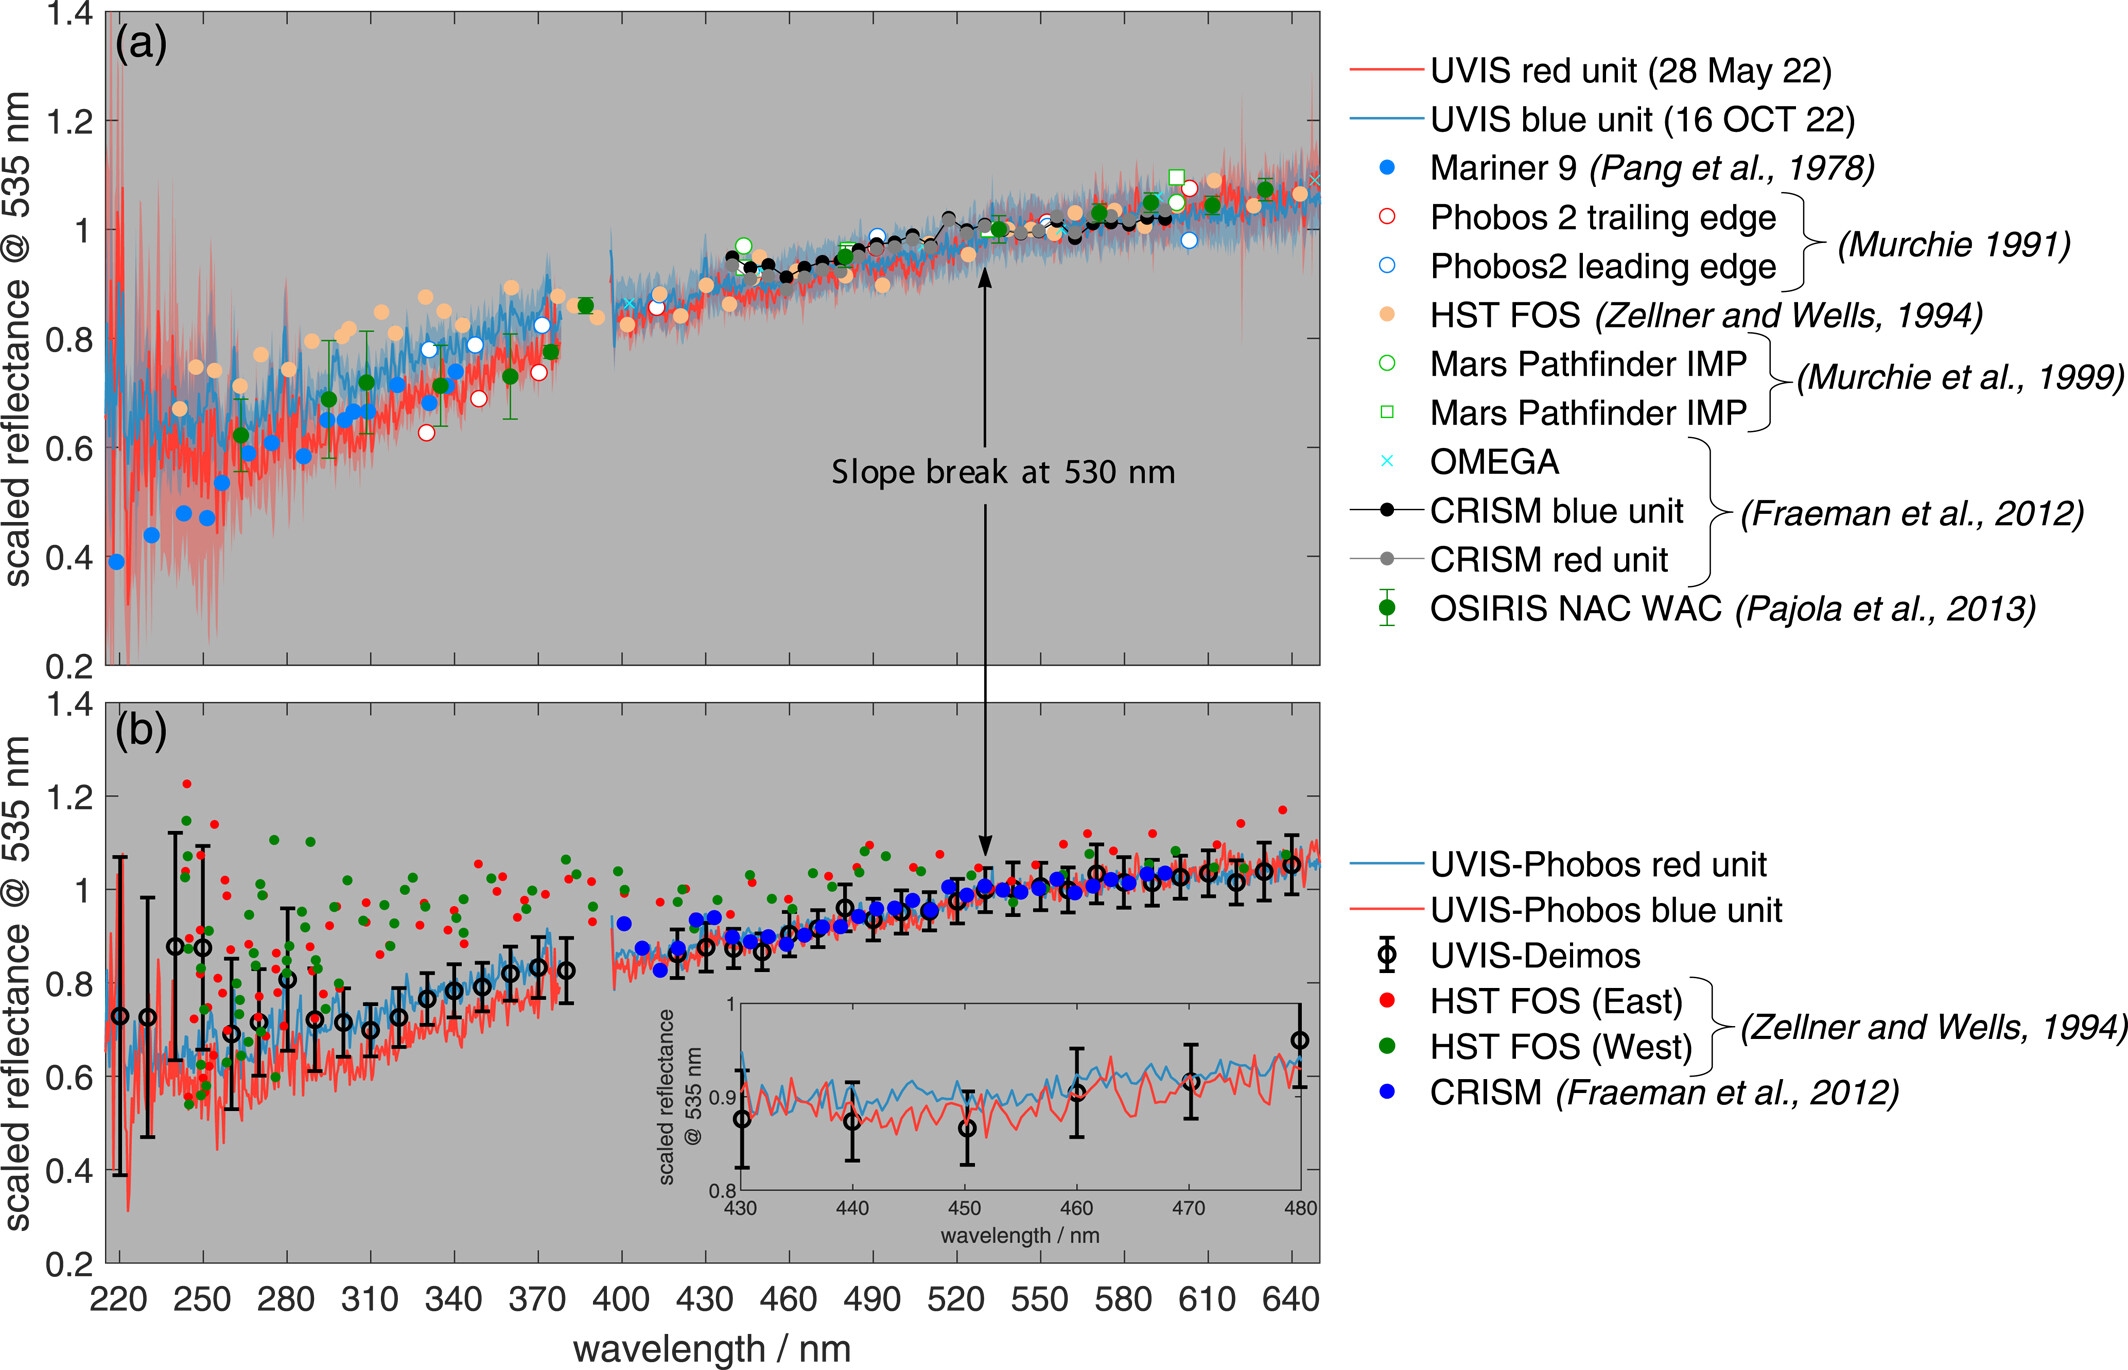
(a) Comparison of the UVIS Phobos blue unit spectrum (blue line) and red unit spectrum (red line) against those made by other instruments. The blue and red shading gives the uncertainty in the UVIS data. Also shown are the Phobos spectra measured by Mariner 9 (light blue circles), Phobos 2 leading (blue-white circles) and trailing (red-white circles) edge of Phobos, HST FOS (orange circles), IMP (green-white circles and squares), OMEGA (red crosses), the CRISM blue unit (black circles) and red unit (gray circle) and OSIRIS (dark green circles). (b) The UVIS Deimos spectra (black line) compared to other Deimos spectra measured by the, Hubble Space Telescope (HST) Faint Object Spectrograph (FOS) red and green dots and the Compact Reconnaissance Imaging Spectrometer for Mars (CRISM) (blue dots). We also show the two UVIS Phobos spectra (blue and red lines) for comparison. The inset in (b) shows a zoomed in the region around potential broad absorption centered near 0.45 μm.
JGR (2023) https://doi.org/10.1029/2023JE008014
Frank Daerden, John N. Crowley, Lori Neary, Michael D. Smith, Mark J. Loeffler, R. Todd Clancy, Michael J. Wolff, Shohei Aoki, Hideo Sagawa
Current models underestimate the highest observed ozone (O3) column densities on Mars. These estimates could be improved by including the uptake of odd hydrogen species (HOx) on water ice clouds, but the reported uptake coefficient of HO2 is likely overestimated for atmospheric conditions. This leaves a fundamental problem in Mars' atmospheric chemistry unsolved. Here, using the GEM-Mars general circulation model, we explore a range of processes involving multiple phases (gas, adsorbed and solid) that may contribute to an alternative solution. First, we focus on hydrogen peroxide (H2O2) and discuss its physical states on Mars and its chemical impact. We also conjecture its photolytic destruction in ices with model simulations and Compact Reconnaissance Imaging Spectrometer for Mars observations. Then, we include in the model all relevant (for Mars) heterogeneous reactions, both on dust and water ice, recommended by the International Union of Pure and Applied Chemistry for terrestrial atmospheric studies. We find that only the uptake of HO2 and H2O2 on dust are efficient on Mars. Finally, we find that attenuation of sunlight by water ice clouds in the calculation of photolysis rates leads to increased O3 and H2O2 abundances below the ice clouds. The combination of the proposed processes leads to O3 increases without the need for strong uptake of HO2 on ice, but it remains difficult to find a good agreement with O3 and H2O2 observations on the global scale. We provide specific recommendations for future work in observations, laboratory experiments and modeling to advance our understanding of fundamental chemistry on Mars.
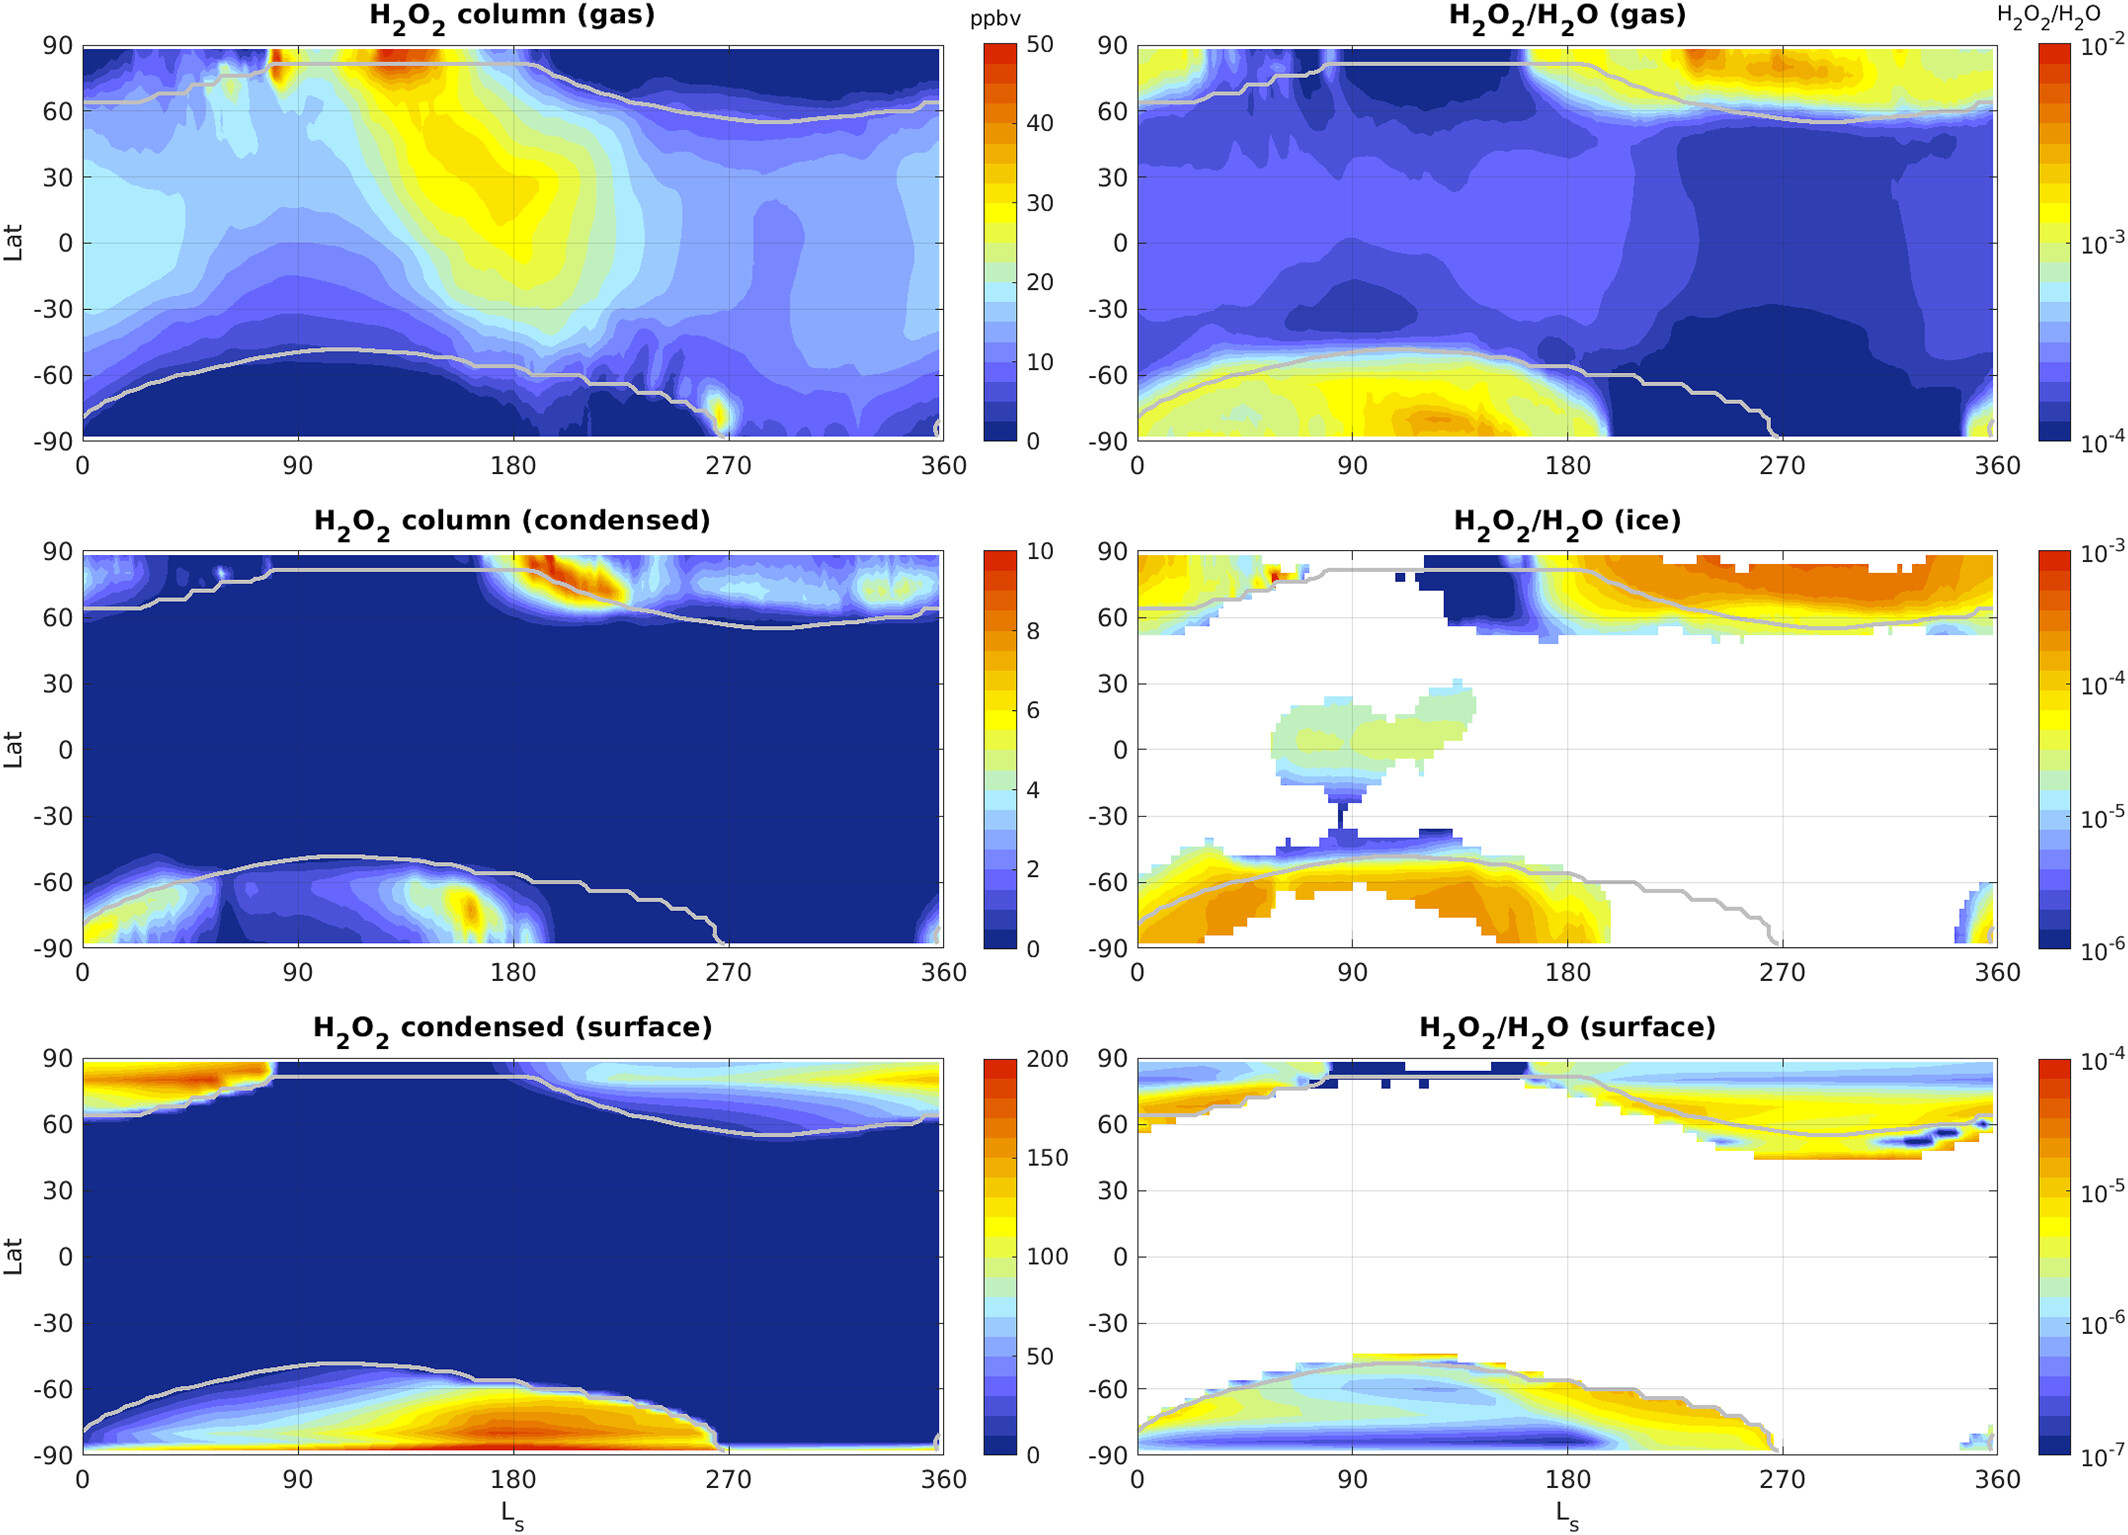
Zonally averaged results from the reference simulation (Hydrogen Peroxide Sublimation, see Table 2). (Left) H2O2 column in the gas-phase (top), and in the condensed phase in the atmosphere (middle) and on the surface (bottom). Total columns are relative to the air column. (Right) H2O2/H2O ratio in the gas phase (top), and in airborne ice (middle) and in surface ice (bottom). All fields were zonally averaged over all longitudes and local times. The gray contour lines represent the edges of the simulated seasonal and permanent polar ice caps. Note the differences in color scale for the various plots.
JGR (2023) https://doi.org/10.1029/2023JE007835
Aurélien Stolzenbach, Miguel-Angel López Valverde, Adrian Brines, Ashimananda Modak, Bernd Funke, Francisco González-Galindo, Ian Thomas, Giuliano Liuzzi, Gerónimo Villanueva, Mikhail Luginin, Shohei Aoki, Udo Grabowski, José Juan Lopez Moreno, Julio Rodriguez-Gomez, Mike Wolff, Bojan Ristic, Frank Daerden, Giancarlo Bellucci, Manish Patel, Ann-Carine Vandaele
This is the second part of Stolzenbach et al. (2023), named hereafter Paper I, extends the period to the end of MY 34 and the first half of MY 35. This encompasses the end phase of the MY 34 Global Dust Storm (GDS), the MY 34 C-Storm, the Aphelion Cloud Belt (ACB) season of MY 35, and an unusual early dust event of MY 35 from LS 30° to LS 55°. The end of MY 34 overall aerosol size distribution shows the same parameters for dust and water ice to what was seen during the MY 34 GDS. Interestingly, the layered water ice vertical structure of MY 34 GDS disappears. The MY 34 C-Storm maintains condition like the MY 34 GDS. A high latitude layer of bigger water ice particles, close to 1 μm, is seen from 50 to 60 km. This layered structure is linked to an enhanced meridional transport characteristic of high intensity dust event which put the MY 34 C-Storm as particularly intense compared to non-GDS years C-Storms as previously suggested by Holmes et al. (2021). Surprisingly, MY 35 began with an unusually large dust event (Kass et al., 2020) found in the Northern hemisphere during LS 35° to LS 50°. During this dust event, the altitude of aerosol first detection is roughly equal to 20 km. This is close to the values encountered during the MY 34 GDS, its decay phase and the C-Storm of the same year. Nonetheless, no vertical layered structure was observed.
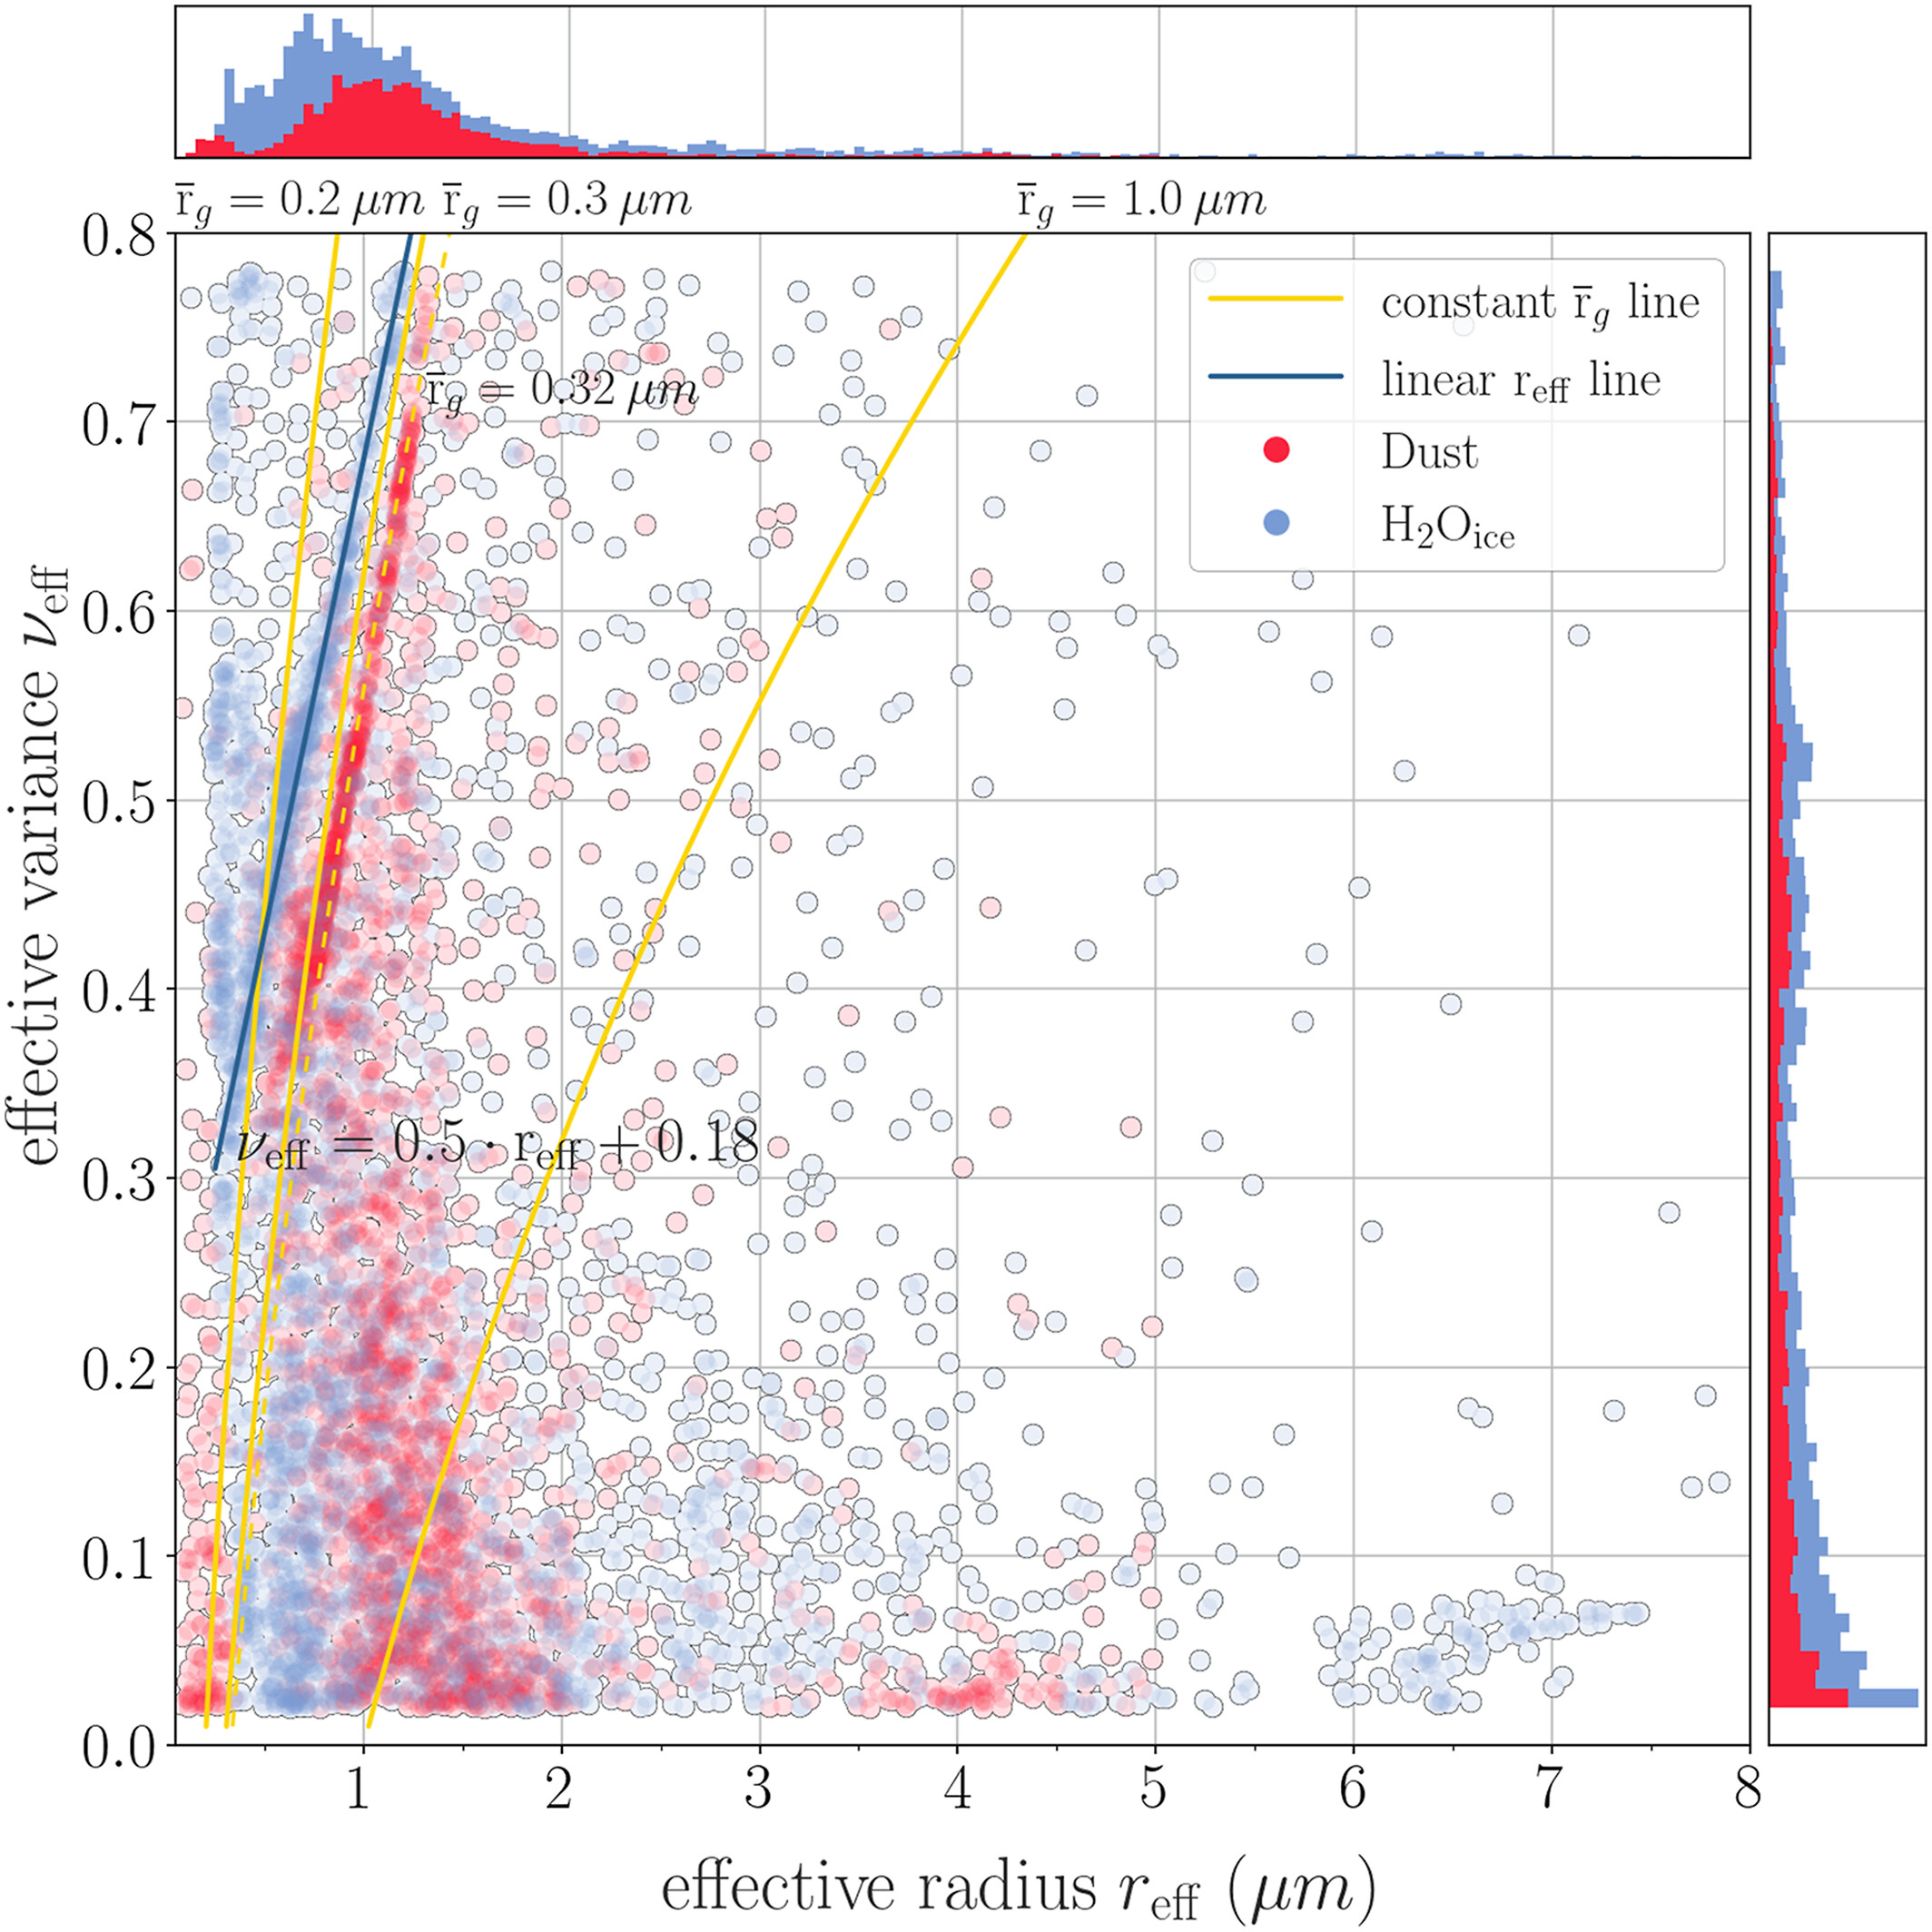
Scatter plot of the dust and water ice effective variance (νeff) against the effective radius (reff). Isolines with constant median radius rg of interest are drawn in yellow. A specific linear evolution of νeff with reff is shown in dark blue.
JGR (2023) https://doi.org/10.1029/2022JE007276
Aurélien Stolzenbach, Miguel-Angel López Valverde, Adrian Brines, Ashimananda Modak, Bernd Funke, Francisco González-Galindo, Ian Thomas, Giuliano Liuzzi, Gerónimo Villanueva, Mikhail Luginin, Shohei Aoki, Udo Grabowski, José Juan Lopez Moreno, Julio Rodrìguez Gòmez, Mike Wolff, Bojan Ristic, Frank Daerden, Giancarlo Bellucci, Manish Patel, Ann-Carine Vandaele
Since the beginning of the Trace Gas Orbiter (TGO) science operations in April 2018, its instrument “Nadir and Occultation for MArs Discovery” (NOMAD) supplies detailed observations of the IR spectrums of the Martian atmosphere. We developed a procedure that allows us to evaluate the composition and distribution's parameters of the atmospheric Martian aerosols. We use a retrieval program (RCP) in conjunction with a radiative forward model (KOPRA) to evaluate the vertical profile of aerosol extinction from NOMAD measurements. We then apply a model/data fitting strategy of the aerosol extinction. In this first article, we describe the method used to evaluate the parameters representing the Martian aerosol composition and size distribution. MY 34 GDS showed a peak intensity from LS 190° to 210°. During this period, the aerosol content rises multiple scale height, reaching altitudes up to 100 km. The lowermost altitude of aerosol's detection during NOMAD observation rises up to 30 km. Dust aerosols reff were observed to be close to 1 μm and its νeff lower than 0.2. Water ice aerosols reff were observed to be submicron with a νeff lower than 0.2. The vertical aerosol structure can be divided in two parts. The lower layers are represented by higher reff than the upper layers. The change between the lower and upper layers is very steep, taking only few kilometers. The decaying phase of the GDS, LS 210°–260°, shows a decrease in altitude of the aerosol content but no meaningful difference in the observed aerosol's size distribution parameters.
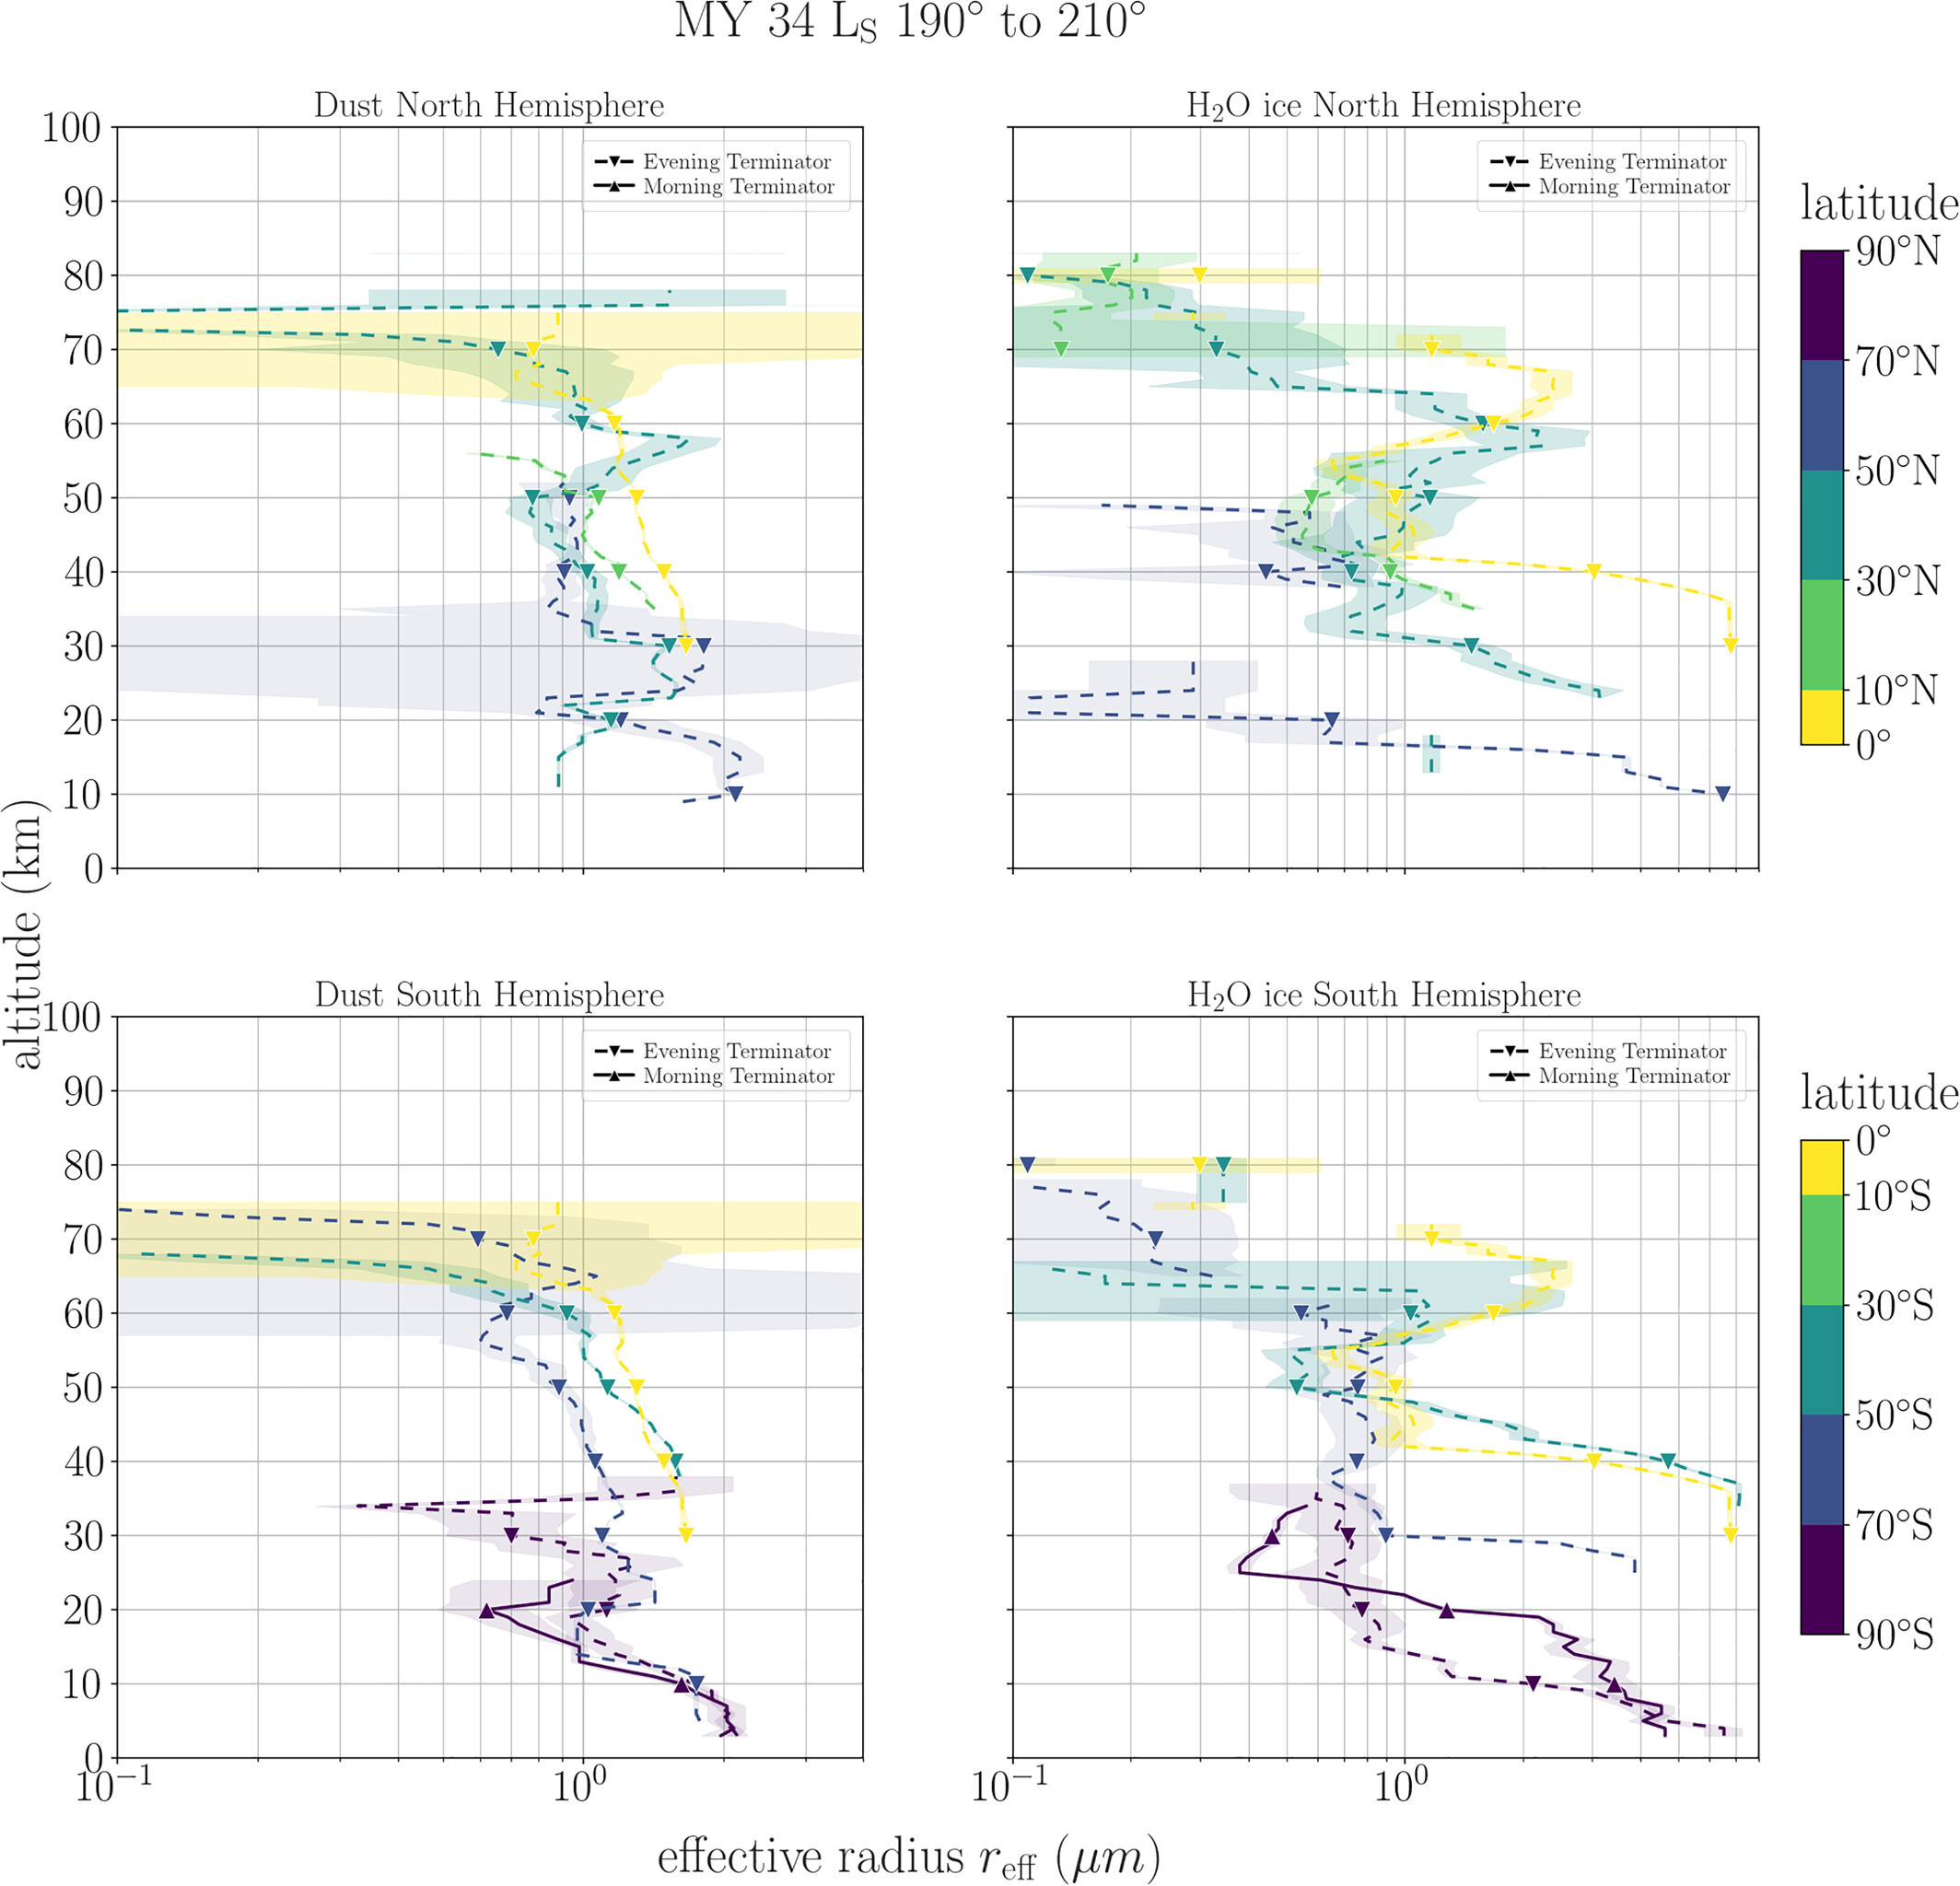
Vertical profiles of the effective radius during the GDS at five latitude ranges. The vertical profiles are derived from a vertical running average using a vertical window of 10 km. The error displayed by the colored area is the greatest value between the standard deviation of the data points and the error in the mean from the running average.
Observation of the Mars O2 visible nightglow by the NOMAD spectrometer onboard the Trace Gas Orbiter
Nature Astronomy (2023) https://doi.org/10.1038/s41550-023-02104-8
J.-C. Gérard, L. Soret, I. R. Thomas, B. Ristic, Y. Willame, C. Depiesse, A. C. Vandaele, F. Daerden, B. Hubert, J. P. Mason, M. R. Patel & M. A. López-Valverde
On Mars, atomic oxygen controls the carbon dioxide radiative cooling of the upper atmosphere and the presence of an ozone layer near the poles. To remotely probe meridional transport of O atoms from the summer to the winter hemisphere and the descending flow in the winter polar regions, the O2 Herzberg II atmospheric emission could be used as a proxy. This emission is quite weak on Earth’s nightside, but it is prominent in the Venus night airglow, and it has not previously been observed on Mars. Here we report the limb detection of the O2 Herzberg II visible bands in the Mars nightglow with the NOMAD ultraviolet–visible spectrometer onboard the European Space Agency’s Trace Gas Orbiter. The emission layer reaches up to hundreds of kilorayleighs in the limb viewing geometry. It is mainly located between 40 km and 60 km at high latitudes during the winter season, consistent with three-body recombination of oxygen atoms. This O2 nightglow should be observable from a Martian orbiter as well as from the Martian surface with the naked eye under clear sky conditions. These observations pave the way to future global observations of the Martian atmospheric circulation with simpler lower-cost instrumentation.
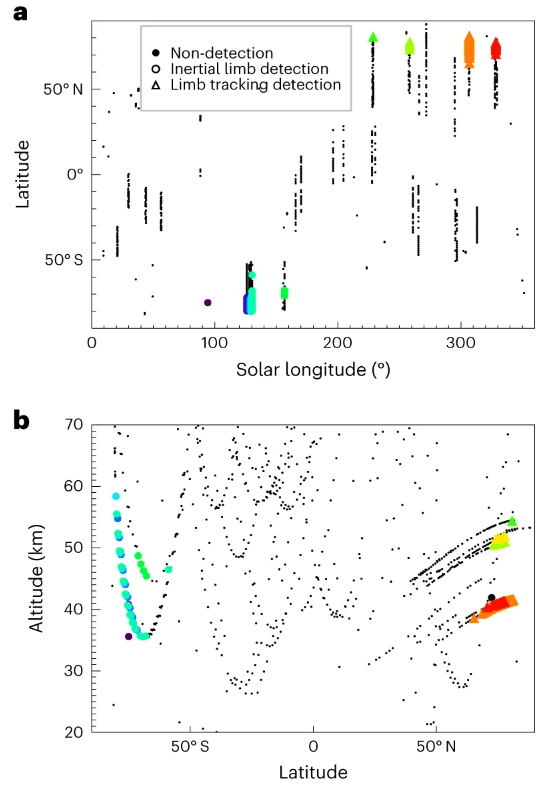
a, Latitude and season of the detections. b, Areoid altitude–latitude map of the observations. The triangles indicate limb tracking and the dots indicate inertial pointing orbits. Each dot colour corresponds to one TGO orbit. Small grey dots correspond to observations without a measurable Herzberg II spectral signature.
Icarus (2023) https://doi.org/10.1016/j.icarus.2023.115698
L. Ruiz Lozano, F. Oliva, Ö. Karatekin, G. Bellucci, V. Dehant, E. D'Aversa, F.G. Carrozzo, F. Schmidt, G. Cruz Mermy, I.R. Thomas, A.C. Vandaele, F. Daerden, B. Ristic, M.R. Patel, J.-J. López-Moreno
Mainly designed to study minor atmospheric species in the Martian atmosphere, the Nadir and Occultation for MArs Discovery (NOMAD) instrument suite onboard the 2016 ExoMars Trace Gas Orbiter (TGO) can also be exploited for surface ice detection. In this work, we investigate the nadir observations of the NOMAD infrared channel from the Martian Years 34 to 36 (Mars 2018 to December 2022), especially for CO2 ice detection. Based on Oliva et al. (2022), we present an updated method taking advantage of the 2.7 μm absorption band for surface ice detection by selecting the diffraction orders 190, 169, 168 and 167. We focus the analysis on the Southern polar cap and define its boundaries during its sublimation phase in MY34–36. Globally, seasonal changes seem repeatable for MY34–36. Moreover, we show the potential of the 2.29 μm absorption band for surface CO2 ice identification through the diffraction order 193. We define a pseudo-band depth as a good proxy for CO2 ice detection. Following a semi-qualitative approach, we attempt to reproduce such spectra by using the Planetary Spectrum Generator (PSG) model in order to estimate CO2 ice equivalent grain size. For the selected periods, the estimations are in the order of centimetres, which is in agreement with previous studies using spectral observations of OMEGA, CRISM and TES instruments.
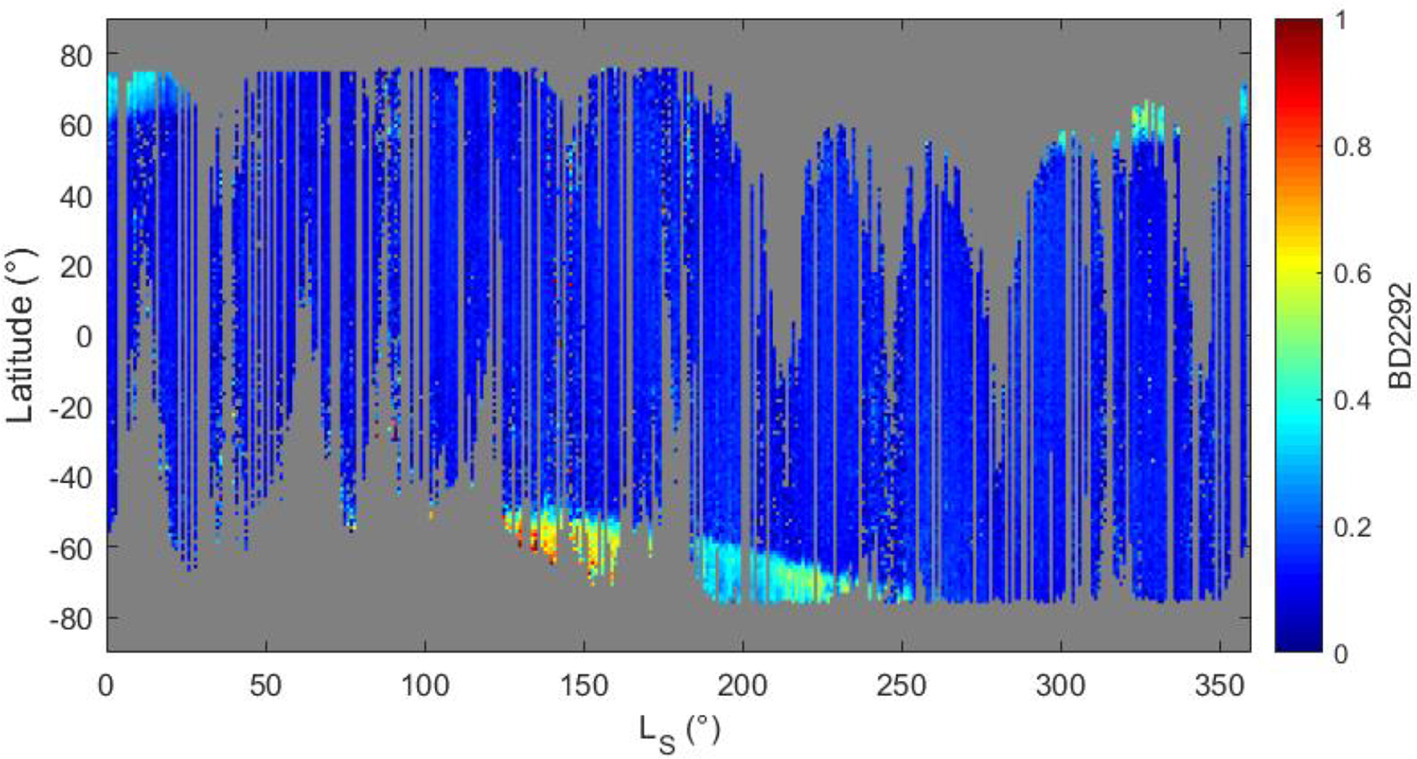
Latitudinal-seasonal map of BD2292 binned 1° by 1°. LNO observations cover all MY35 and 36 for a SZA < 75°
PSJ (2023) https://doi.org/10.3847/PSJ/acd32f
S. Aoki, K. Shiobara, N. Yoshida, L. Trompet, T. Yoshida, N. Terada, H. Nakagawa, G. Liuzzi, A. C. Vandaele, I. R. Thomas
The atmosphere of Mars is mainly composed by carbon dioxide (CO2). It has been predicted that photodissociation of CO2 depletes 13C in carbon monoxide (CO). We present the carbon 13C/12C isotopic ratio in CO at 30–50 km altitude from the analysis of the solar occultation measurements taken by the instrument Nadir and Occultation for Mars Discovery on board the ExoMars Trace Gas Orbiter (ExoMars-TGO). We retrieve 12C16O, 13C16O, and 12C18O volume mixing ratios from the spectra taken at 4112–4213 cm−1, where multiple CO isotope lines with similar intensities are available. The intensities of the 12C16O lines in this spectral range are particularly sensitive to temperature, thus we derive the atmospheric temperature by retrieving CO2 density with simultaneously measured spectra at 2966–2990 cm−1. The mean δ13C value obtained from the 13C16O/12C16O ratios is −263‰, and the standard deviation and standard error of the mean are 132‰ and 4‰, respectively. The relatively large standard deviation is due to the strong temperature dependences in the 12C16O lines. We also examine the 13C16O/12C18O ratio, whose lines are less sensitive to temperature. The mean δ value obtained with 12C18O instead of 12C16O is −82‰ with smaller standard deviation, 60‰. These results suggest that CO is depleted in 13C when compared to CO2 in the Martian atmosphere as measured by the Curiosity rover. This depletion of 13C in CO is consistent with the CO2 photolysis-induced fractionation, which might support a CO-based photochemical origin of organics in Martian sediments.
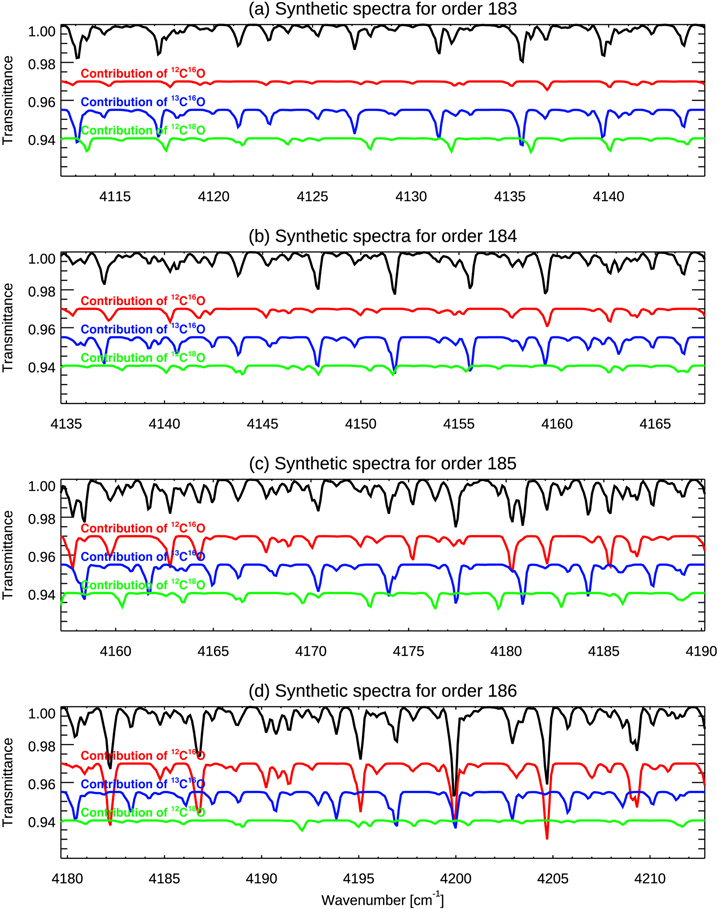
Synthetic spectra of the NOMAD measurements taken with diffraction order 183 (a), order 184 (b), order 185 (c), and order 186 (b) around 30 km tangent height. The assumed vertical profile of total CO volume mixing ratio is 1000 ppm (uniform) and along the line of sight. The isotopic ratios defined in the HITRAN2020 databases are assumed. The red, blue, and green curves illustrate contributions due to 12C16O, 13C16O, and 12C18O absorption lines. The origin of the Y-axis for the red, blue, and green curves have been offset to improve visibility.
(2023) JGR https://doi.org/10.1029/2023JE007762
L. Soret, J.-C. Gérard, B. Hubert, A. C. Vandaele, I. R. Thomas, B. Ristic, Y. Willame, N. Schneider, S. Jain, S. Gupta, J. P. Mason, M. R. Patel
The Trace Gas Orbiter has been orbiting Mars since 2016 with the Nadir and Occultation for MArs Discovery (NOMAD) UltraViolet and Visible Spectrometer (UVIS) instrument on board. Focusing on limb observations recorded in the ultraviolet (UV) part of the NOMAD/UVIS spectra, we describe here the CO Cameron bands, CO2+ UV doublet and Fox-Duffendach-Barker (FDB) bands and [OI] UV emissions. Averaged limb profiles are presented, showing that the strongest brightness and the highest peak altitudes are reached near perihelion. Ratios between the UV emissions are also estimated and compared with previous observations from Mariner and Mars Express. NOMAD/UVIS is the first instrument able to simultaneously acquire data both in the UV and the visible in the Mars atmosphere so that the oxygen green line at 557.7 nm and its UV counterpart at 297.2 nm, both originating from the same O(1S) upper state level, may be directly compared. A mean ratio of 15.8 is derived, in close agreement with ab initio calculations. The spectral composition of the CO2+ FDB system that has not been observed entirely since the Mariner missions in the 1970s is analyzed. According to the spectral composition of the FDB bands, we show that this emission is produced at ∼70% by photoionization of CO2 (which populates the shorter wavelengths of the spectrum) and ∼30% by resonance scattering of solar radiation (which populates longer wavelengths). No evidence of a change with altitude in the CO2+ FDB spectral composition is observed in the NOMAD/UVIS spectra.
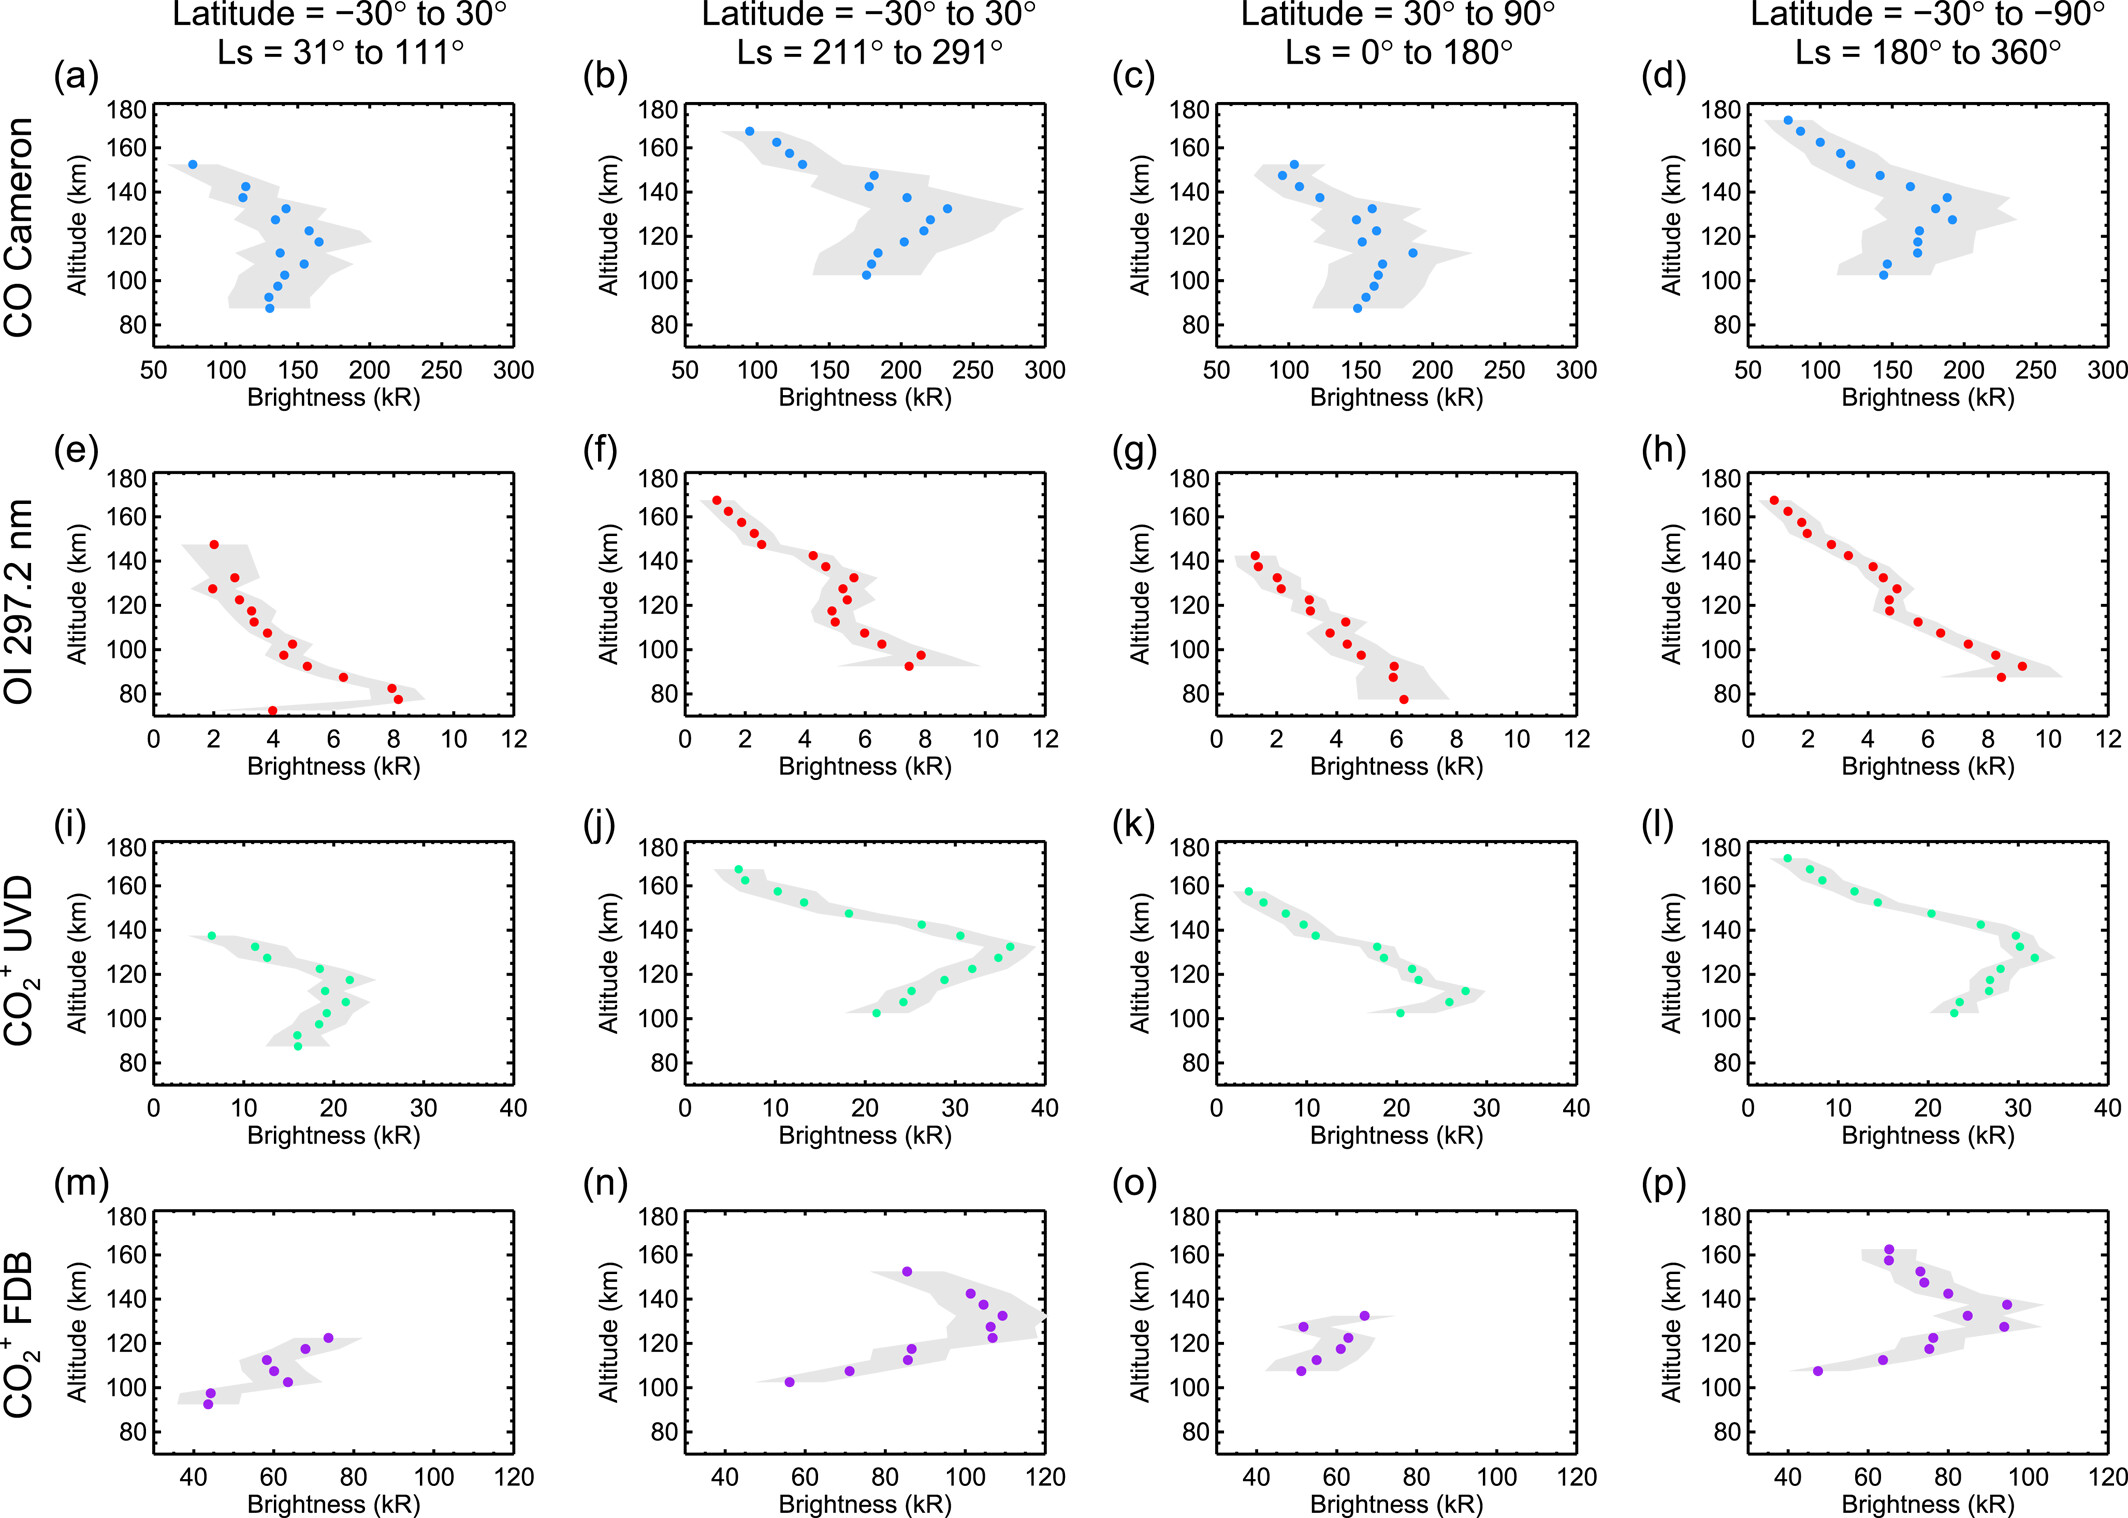
Limb profiles of ultraviolet dayglow emissions (Cameron bands in blue, OI 297.2 nm in red, ultraviolet doublet in green and Fox-Duffendach-Barker in purple, organized by rows, from top to bottom) averaged in the equatorial region near aphelion (first column) and near perihelion (second column), in the northern summer hemisphere (third column) and during the southern summer (last column).
2023 (JGR) https://doi.org/10.1029/2022JE007282 http://oro.open.ac.uk/87558/1/87558.pdf
Ashimananda Modak, Miguel Angel López-Valverde, Adrian Brines, Aurélien Stolzenbach, Bernd Funke, Francisco González-Galindo, Brittany Hill, Shohei Aoki, Ian Thomas, Giuliano Liuzzi, Gerónimo Villanueva, Justin Erwin, José Juan Lopez Moreno, Nao Yoshida, Udo Grabowski, Francois Forget, Frank Daerden, Bojan Ristic, Giancarlo Bellucci, Manish Patel, Loic Trompet, Ann Carine Vandaele
We present CO density profiles up to about 100 km in the Martian atmosphere obtained for the first time from retrievals of solar occultation measurements by the Nadir and Occultation for Mars Discovery (NOMAD) onboard ExoMars Trace Gas Orbiter (TGO). CO is an important trace gas on Mars, as it is controlled by CO2 photolysis, chemical reaction with the OH radicals, and the global dynamics. However, the measurements of CO vertical profiles have been elusive until the arrival of TGO. We show how the NOMAD CO variations describe very well the Mars general circulation. We observe a depletion of CO in the upper troposphere and mesosphere during the peak period, LS = 190°–200°, more pronounced over the northern latitudes, confirming a similar result recently reported by Atmospheric Chemistry Suite onboard TGO. However, in the lower troposphere around 20 km, and at least at high latitudes of the S. hemisphere, NOMAD CO mixing ratios increase over 1,500 ppmv during the GDS (Global Dust Storm) onset. This might be related to the downwelling branch of the Hadley circulation. A subsequent increase in tropospheric CO is observed during the decay phase of the GDS around LS = 210°–250° when the dust loading is still high. This could be associated with a reduction in the amount of OH radicals in the lower atmosphere due to lack of solar insolation. Once the GDS is over, CO steadily decreases globally during the southern summer season. A couple of distinct CO patterns associated with the Summer solstice and equinox circulation are reported and discussed.
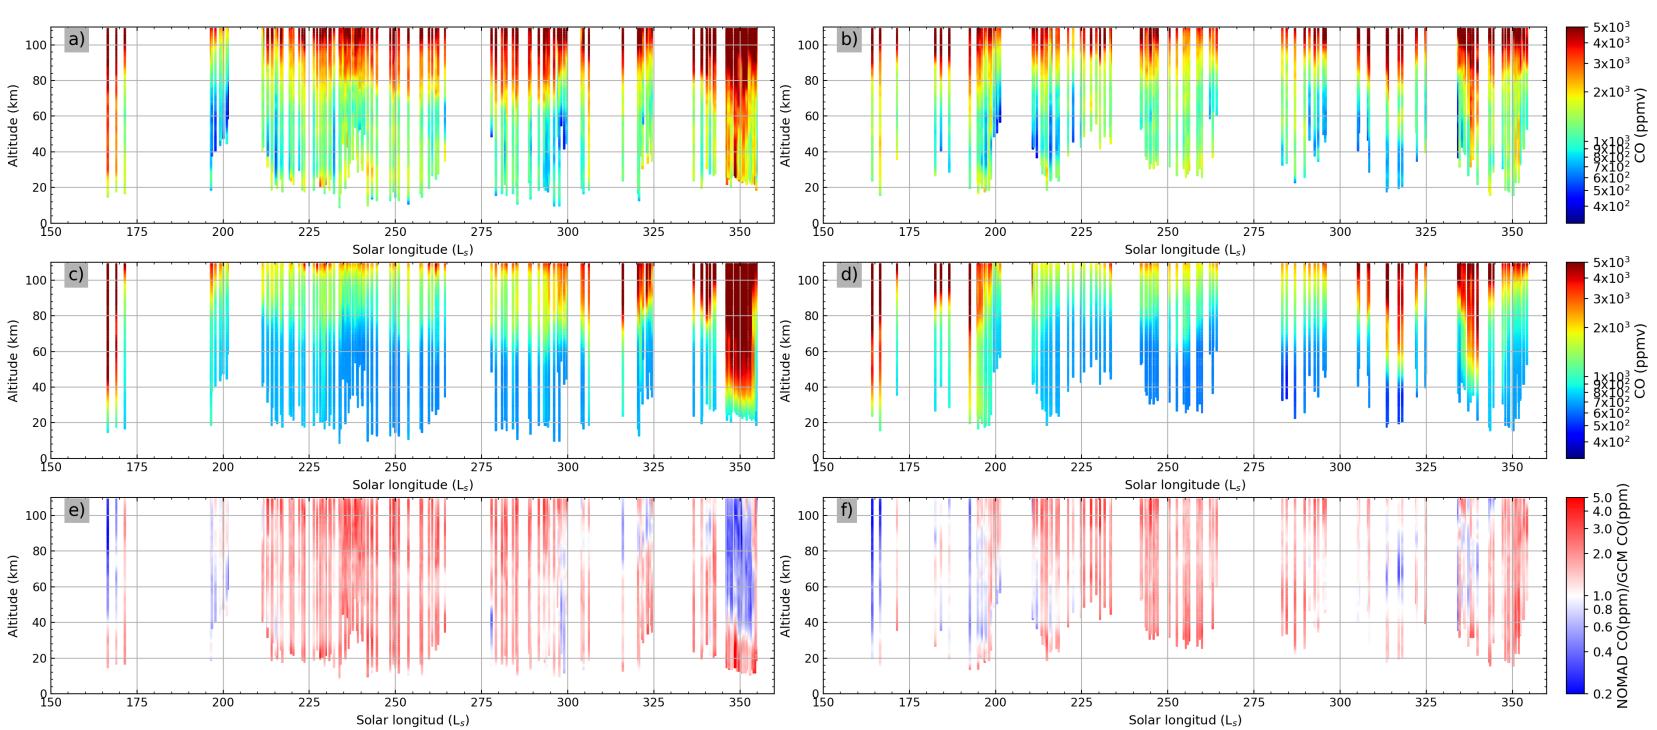
Comparison of PCM CO densities with the retrieved ones. The top panels a and b show the retrieved CO VMR. Panels c and d show the PCM CO mixing ratios and panels e and f show the ratios NOMAD/PCM. Left panels (a, c, and e) correspond to the Northern Hemisphere and right panels (b, d, and f) to the Southern Hemisphere.
2023 (JGR) https://doi.org/10.1029/2022EA002429
A. Piccialli, A. C. Vandaele, Y. Willame, A. Määttänen, L. Trompet, J. T. Erwin, F. Daerden, L. Neary, S. Aoki, S. Viscardy, I. R. Thomas, C. Depiesse, B. Ristic, J. P. Mason, M. R. Patel, M. J. Wolff, A. S. J. Khayat, G. Bellucci, J.-J. Lopez-Moreno
The NOMAD-UVIS instrument on board the ExoMars Trace Gas Orbiter has been investigating the Martian atmosphere with the occultation technique since April 2018. Here, we analyze almost two Mars Years of ozone vertical distributions acquired at the day-night terminator. The ozone retrievals proved more difficult than expected due to spurious detections of ozone caused by instrumental effects, high dust content, and very low values of ozone. This led us to compare the results from three different retrieval approaches: (a) an onion peeling method, (b) a full occultation Optimal Estimation Method, and (c) a direct onion peeling method. The three methods produce consistently similar results, especially where ozone densities are higher. The main challenge was to find reliable criteria to exclude spurious detections of O3, and we finally adopted two criteria for filtering: (a) a detection limit, and (b) the Δχ2 criterion. Both criteria exclude spurious O3 values especially near the perihelion (180° < Ls < 340°), where up to 98% of ozone detections are filtered out, in agreement with general circulation models, that expect very low values of ozone in this season. Our agrees well with published analysis of the NOMAD-UVIS data set, as we confirm the main features observed previously, that is, the high-altitude ozone peak around 40 km at high latitudes. The filtering approaches are in good agreement with those implemented for the SPICAM/MEx observations and underline the need to evaluate carefully the quality of ozone retrievals in occultations.
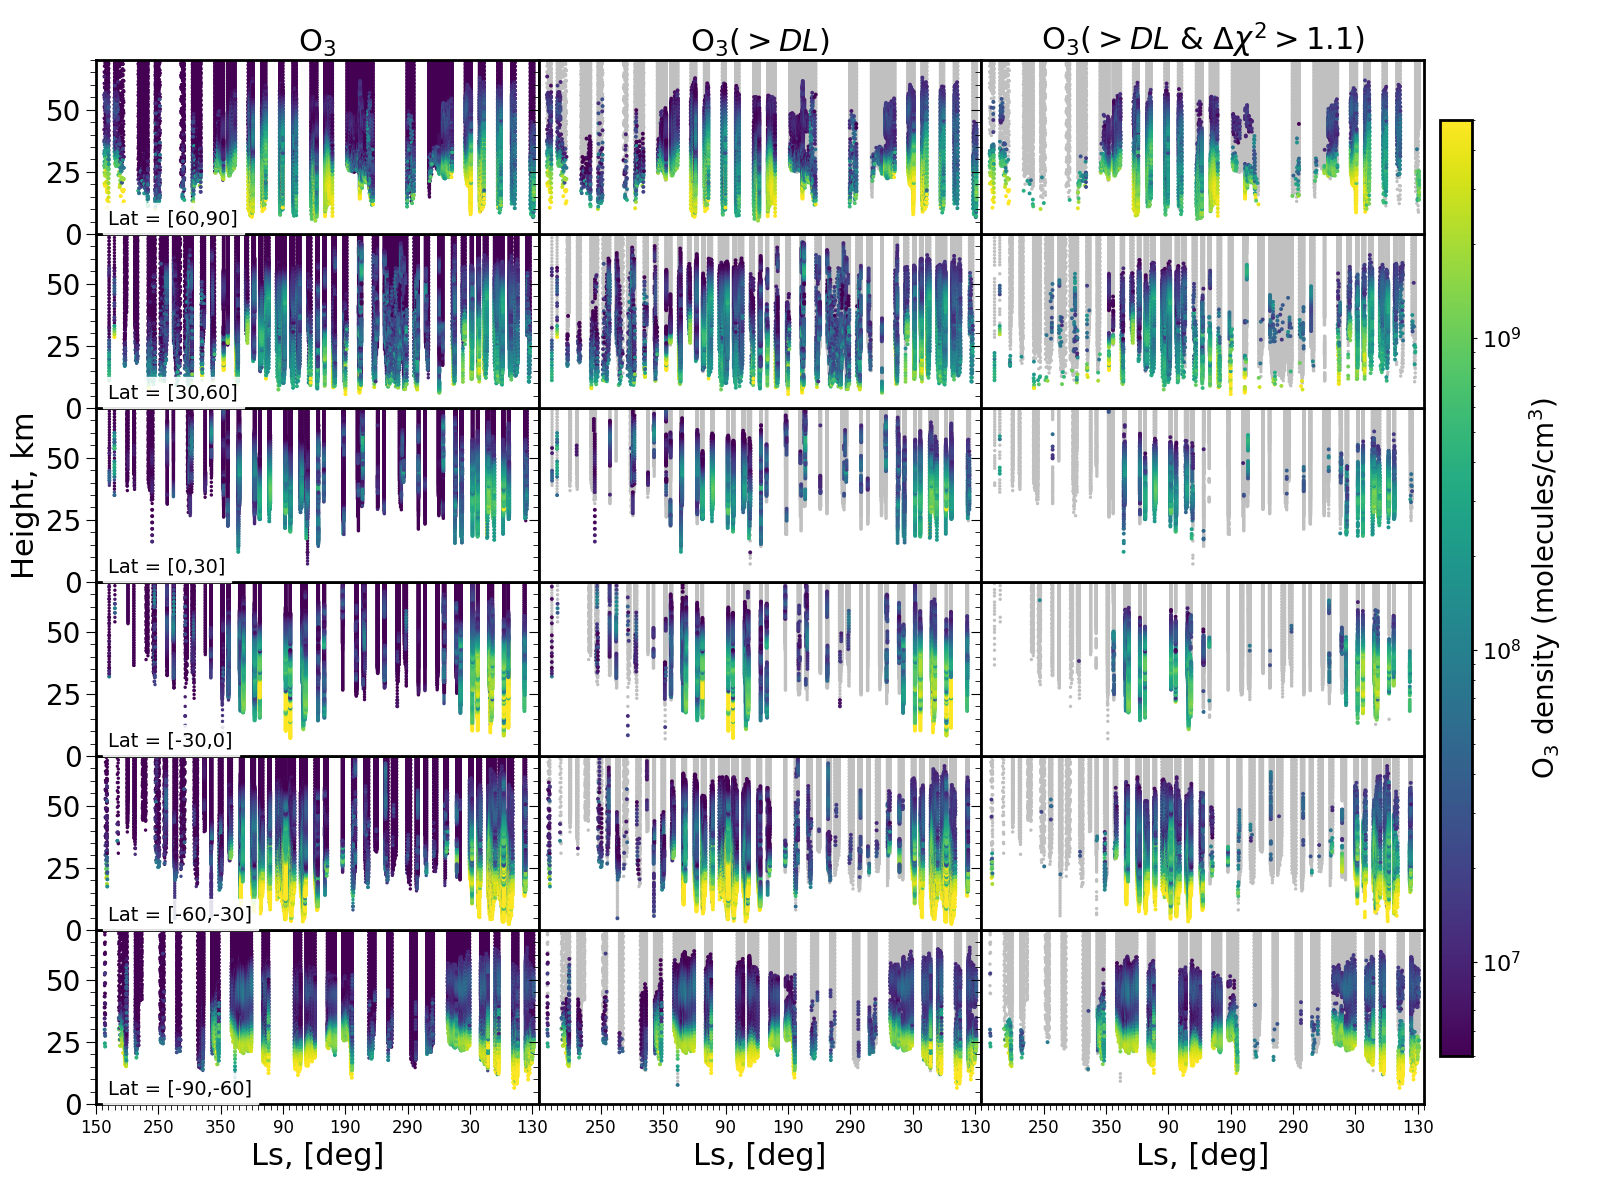
Seasonal evolution of FOEM ozone abundance observed by NOMAD-UVIS for different latitude ranges. Left panels show the ozone retrievals without any filtering; in the middle panels we applied the DL filter; and in the right panels we applied both the DL and Δχ2 filters.
2023 (JGR) https://doi.org/10.1029/2022JE007279
L. Trompet, A.C. Vandaele, I. Thomas, S. Aoki, F. Daerden, J. Erwin, Z. Flimon, A. Mahieux, L. Neary, S. Robert, G. Villanueva, G. Liuzzi, Lopez Valverde, A. Brines, G. Bellucci, J. J. Lopez-Moreno, M. R. Patel
The Solar Occultation (SO) channel of the Nadir and Occultation for Mars Discovery (NOMAD) instrument scans the Martian atmosphere since 21 April 2018. In this work, we present a subset of the NOMAD SO data measured at the mesosphere. We focused on a spectral range that started to be recorded in Martian Year (MY) 35. A total of 968 vertical profiles of carbon dioxide density and temperature covering MY 35 and the beginning of MY 36 are investigated until 135° of solar longitude. We compared 47 profiles with co-located profiles of Mars Climate Sounder onboard Mars Reconnaissance Orbiter. Most profiles show a good agreement as SO temperatures are only 1.8 K higher but some biases lead to an average absolute difference of 7.4°K. The SO dataset is also compared with simulations from GEM-Mars general circulation model. Both datasets are in good agreement except for the presence of a cold layer in the winter hemisphere and a warm layer at dawn in the Northern hemisphere for solar longitudes between 240° to 360°. Five profiles contain temperatures lower than the limit for CO2 condensation. Strong warm layers are found in 13.5% of the profiles. They are present mainly at dawn and in the winter hemisphere while the Northern dusks appear featureless. The dataset mainly covers high latitudes around 60° and we derived some non-migrating tides. In the Southern winter hemisphere, we derived apparent zonal wavenumber-1 and wavenumber-3 tidal components with a maximum amplitude of 10% and 5% at 63 km, respectively.
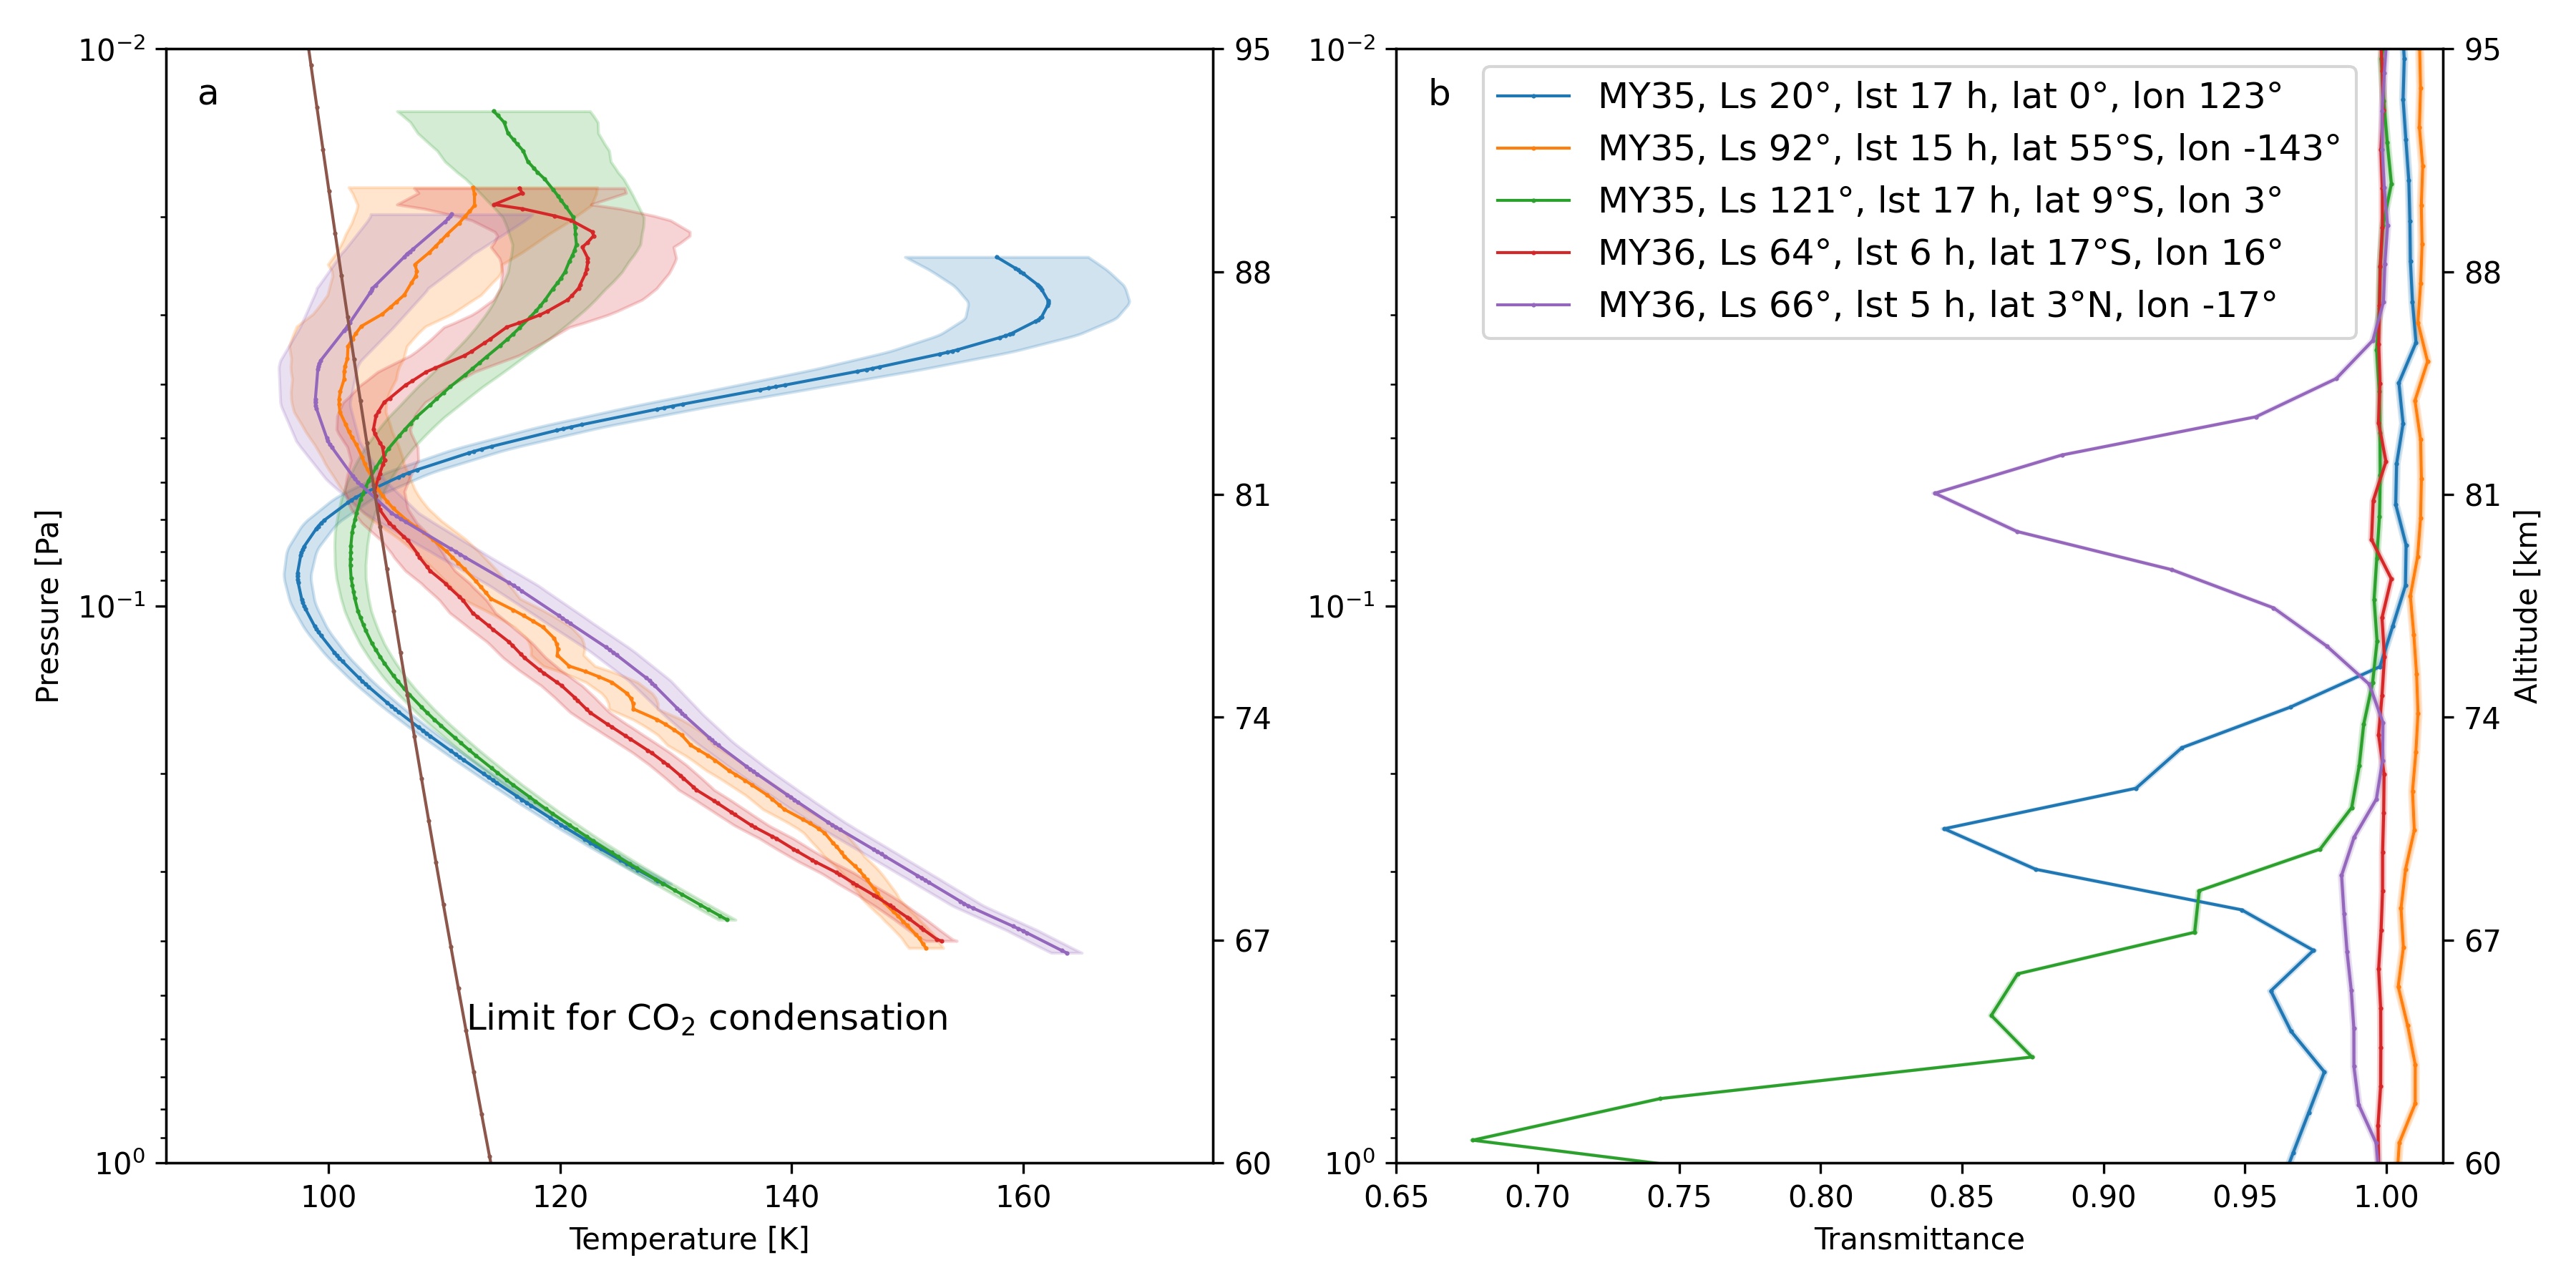
Panel a) six temperature profiles for diffraction order 148 with some values lower than the temperature limit for CO2
condensation. Panel b) transmittances at pixel 180 corresponding to the profiles in panel a. The second Y-axis provides rough
altitude values.
JGR (2023) https://doi.org/10.1029/2022JE007277
L. Trompet, A.C. Vandaele, I. Thomas, S. Aoki, F. Daerden, J. Erwin, Z. Flimon, A. Mahieux, L. Neary, S. Robert, G. Villanueva, G. Liuzzi, Lopez-Valverde, A. Brines, G. Bellucci, J. J. Lopez-Moreno, M. R. Patel
The SO (Solar Occultation) channel of the Nadir and Occultation for Mars Discovery (NOMAD) instrument has been scanning the Martian atmosphere for almost two Martian years. In this work, we present a subset of the NOMAD SO data measured at the mesosphere at the terminator. From the dataset, we investigated 968 vertical profiles of carbon dioxide density and temperature covering Martian Year (MY) 35 as well as MY 36 up to a solar longitude (Ls) of 135° and altitudes around 60 km to 100 km. While carbon dioxide density profiles are directly retrieved from the spectral signature in the spectra, temperature profiles are more challenging to retrieve as unlike density profiles, temperature profiles can present some spurious features if the regularization is not correctly managed. Comparing seven regularization methods, we found that the expected error estimation method provides the best regularization parameters. The vertical resolution of the profiles is on average 1.6 km. Numerous warm layers and cold pockets appear in this dataset. The warm layers are found in the Northern hemisphere at dawn and dusk as well as in the Southern hemisphere at dawn. Strong warm layers are present in more than 13.5% of the profiles. The Southern hemisphere at dusk does not present any warm layer between Ls 50° and 150°. The height and latitudinal distribution of those warm layers are similar in MY 35 and MY 36 during the first half of the year (Ls=0 - 135°).
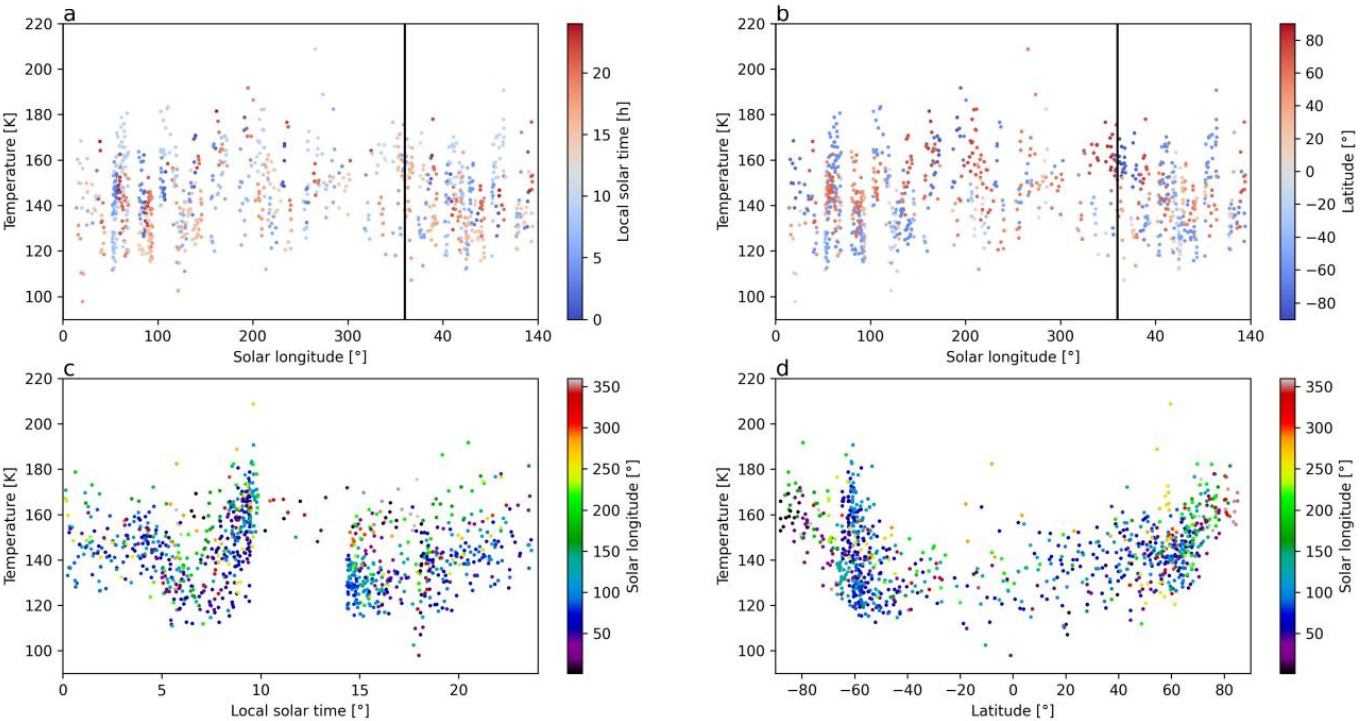
Retrieved temperature for a pressure of 0.1 Pa over MY 35 and MY 36 until Ls 135° as a function of solar longitude (panels a and b), as a function of local solar time (panel c), and as a function of latitude (panel d). In Panel a, the color code corresponds to the solar local time, and in panel b to the latitude. Local solar time and latitudinal trends are present in panels a and b.
JGR (2022), https://doi.org/10.1029/2022JE007273
A. Brines, M. A. López-Valverde, A. Stolzenbach, A. Modak, B. Funke, F. G. Galindo, S. Aoki, G. L. Villanueva, G. Liuzzi, I. R. Thomas, J. T. Erwin, U. Grabowski, F. Forget, J. J. Lopez-Moreno, J. Rodriguez-Gomez, F. Daerden, L. Trompet, B. Ristic, M. R. Patel, G. Bellucci, A. C. Vandaele
The water vapor in the Martian atmosphere plays a significant role in the planet’s climate, being crucial in most of the chemical and radiative transfer processes. Despite its importance, the vertical distribution of H2O in the atmosphere has not still been characterized precisely enough. The recent ExoMars Trace Gas Orbiter (TGO) mission, with its Nadir and Occultation for MArs Discovery (NOMAD) instrument, has allowed us to measure the H2O vertical distribution with unprecedented resolution. Recent studies of vertical profiles have shown that high dust concentration in the atmosphere, in particular during dust storms, induces an efficient transport of the H2O to higher altitudes, from 40 km up to 80 km. We study the H2O vertical distribution in a subset of solar occultations during the perihelion of two Martian years (MYs), including the 2018 Global Dust Storm (GDS), in order to compare the same Martian season under GDS and non-GDS conditions. We present our state-of-the-art retrieval scheme, and we apply it to a combination of two diffraction orders, which permits sounding up to about 100 km. We confirm recent findings of H2O increasing at high altitudes during Ls = 190-205° in MY 34, reaching abundances of about 150 ppmv at 80 km in both hemispheres not found during the same period of MY 35. We found a hygropause’s steep rising during the GDS from 30 up to 80 km. Furthermore, strong supersaturation events have been identified at mesospheric altitudes even in presence of water ice layers retrieved by the IAA team.
Seasonal vertical distribution maps of the retrieved water vapor (b,d) during the MY 34 in the Northern (left panels) and the Southern (right panels) hemispheres. The red line indicates the hygropause level. Top panels (a,c) show the latitudes and the Local Solar Time of the observations analyzed.
JGR (2022); https://doi.org/10.1029/2022JE007203
J. A. Holmes, S. R. Lewis, M. R. Patel, J. Alday, S. Aoki, G. Liuzzi, G. L. Villanueva, M. M. J. Crismani, A. A. Fedorova, K. S. Olsen, D. M. Kass, A. C. Vandaele, O. Korablev
To understand the evolving martian water cycle, a global perspective of the combined vertical and horizontal distribution of water is needed in relation to supersaturation and water loss and how it varies spatially and temporally. The global vertical water vapor distribution is investigated through an analysis that unifies water, temperature and dust retrievals from several instruments on multiple spacecraft throughout Mars Year (MY) 34 with a global circulation model. During the dusty season of MY 34, northern polar latitudes are largely absent of water vapor below 20 km with variations above this altitude due to transport from mid-latitudes during a global dust storm, the downwelling branch of circulation during perihelion season and the intense MY 34 southern summer regional dust storm. Evidence is found of supersaturated water vapor breaking into the northern winter polar vortex. Supersaturation above around 60 km is found for most of the time period, with lower altitudes showing more diurnal variation in the saturation state of the atmosphere. Discrete layers of supersaturated water are found across all latitudes. The global dust storm and southern summer regional dust storm forced water vapor at all latitudes in a supersaturated state to 60–90 km where it is more likely to escape from the atmosphere. The reanalysis data set provides a constrained global perspective of the water cycle in which to investigate the horizontal and vertical transport of water throughout the atmosphere, of critical importance to understand how water is exchanged between different reservoirs and escapes the atmosphere.
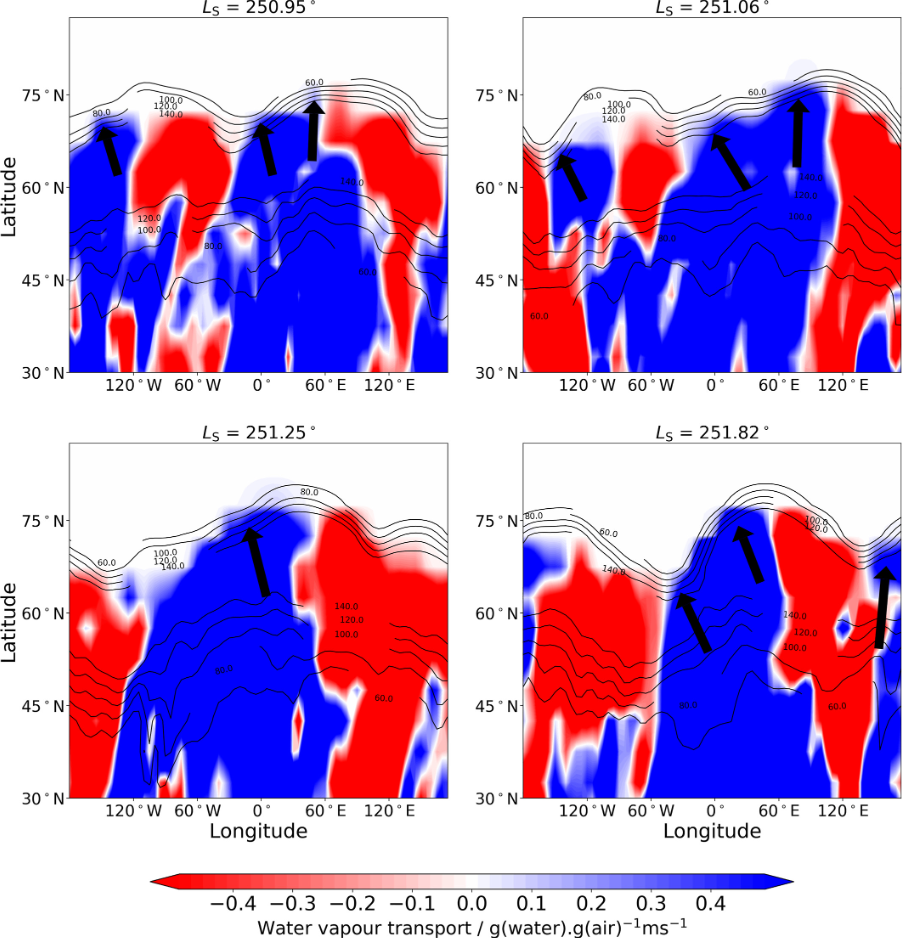
Longitude-latitude maps at 35 km of the meridional transport of water vapor in the water reanalysis at the time specified above each subplot. Blue/red indicates transport to the north/south. Black contours indicate the zonal wind at 35 km. Black arrows indicate where water vapor is crossing the northern winter polar vortex boundary.
JGR (2022); https://doi.org/10.1029/2022JE007346
M. A. J. Brown, M. R. Patel, S. R. Lewis, J. A. Holmes, G. J. Sellers, P. M. Streeter, A. Bennaceur, G. Liuzzi, G. L. Villanueva, A. C. Vandaele
We show a positive vertical correlation between ozone and water ice using a vertical cross-correlation analysis with observations from the ExoMars Trace Gas Orbiter's Nadir and Occultation for Mars Discovery instrument. This is particularly apparent during LS = 0°–180°, Mars Year 35 at high southern latitudes, when the water vapor abundance is low. Ozone and water vapor are anti-correlated on Mars; Clancy et al. (2016, https://doi.org/10.1016/j.icarus.2015.11.016) also discuss the anti-correlation between ozone and water ice. However, our simulations with gas-phase-only chemistry using a 1-D model show that ozone concentration is not influenced by water ice. Heterogeneous chemistry has been proposed as a mechanism to explain the underprediction of ozone in global climate models (GCMs) through the removal of HOx. We find improving the heterogeneous chemical scheme by creating a separate tracer for the HOx adsorbed state, causes ozone abundance to increase when water ice is present (30–50 km), better matching observed trends. When water vapor abundance is high, there is no consistent vertical correlation between observed ozone and water ice and, in simulated scenarios, the heterogeneous chemistry has a minor influence on ozone. HOx, which are by-products of water vapor, dominate ozone abundance, masking the effects of heterogeneous chemistry on ozone, and making adsorption of HOx have a negligible impact on ozone. This is consistent with gas-phase-only modeled ozone, showing good agreement with observations when water vapor is abundant. Overall, the inclusion of heterogeneous chemistry improves the ozone vertical structure in regions of low water vapor abundance, which may partially explain GCM ozone deficits.
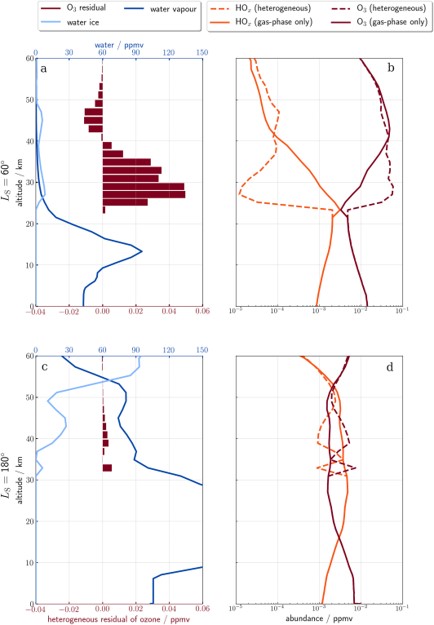
Modeled profiles from the 1‐dimensional Martian Photochemical Modelof (a and b) low water vapor (at LS = 60°), and (c and d) high water vapor (at LS = 180°) at latitude 0°, local solar time 1200 hr (First column; a and c) vertical profiles of (light blue) water ice, (dark blue) water vapor, and (dark red bars) the ozone residual (calculated by subtracting the heterogeneous ozone from the gas‐phase only ozone). Abundance difference for ozone is on the bottom x‐axis and abundance for water ice and vapor is on the top x‐axis. (Second column; b and d) vertical profiles of (dark red) ozone and (orange) HOx for (dashed) heterogeneous and (solid) gas‐phase‐only simulations. Note the abundances are on a logarithmic scale.
JGR (2022); https://doi.org/10.1029/2022JE007278
Miguel-Angel López Valverde, Bernd Funke, Adrian Brines, Aurèlien Stolzenbach, Ashimananda Modak, Brittany Hill, Francisco González-Galindo, Ian Thomas, Loic Trompet, Shohei Aoki, Gerónimo Villanueva, Giuliano Liuzzi, Justin Erwin, Udo Grabowski, Francois Forget, José Juan Lopez Moreno, Julio Rodriguez-Gómez, Bojan Ristic, Frank Daerden, Giancarlo Bellucci, Manish Patel, Ann-Carine Vandaele, the NOMAD team
We present vertical profiles of temperature and density from solar occultation (SO) observations by the “Nadir and Occultation for Mars Discovery” (NOMAD) spectrometer on board the Trace Gas Orbiter (TGO) during its first operational year, which covered the second half of Mars Year 34. We used calibrated transmittance spectra in 380 scans, and apply an in-house pre-processing to clean data systematics. Temperature and CO2 profiles up to about 90 km, with consistent hydrostatic adjustment, are obtained, after adapting an Earth-tested retrieval scheme to Mars conditions. Both pre-processing and retrieval are discussed to illustrate their performance and robustness. Our results reveal the large impact of the MY34 Global Dust Storm (GDS), which warmed the atmosphere at all altitudes. The large GDS aerosols opacity limited the sounding of tropospheric layers. The retrieved temperatures agree well with global climate models (GCM) at tropospheric altitudes, but NOMAD mesospheric temperatures are wavier and globally colder by 10 K in the perihelion season, particularly during the GDS and its decay phase. We observe a warm layer around 80 km during the Southern Spring, especially in the Northern Hemisphere morning terminator, associated to large thermal tides, significantly stronger than in the GCM. Cold mesospheric pockets, close to CO2 condensation temperatures, are more frequently observed than in the GCM. NOMAD CO2 densities show oscillations upon a seasonal trend that track well the latitudinal variations expected. Results uncertainties and suggestions to improve future data re-analysis are briefly discussed.
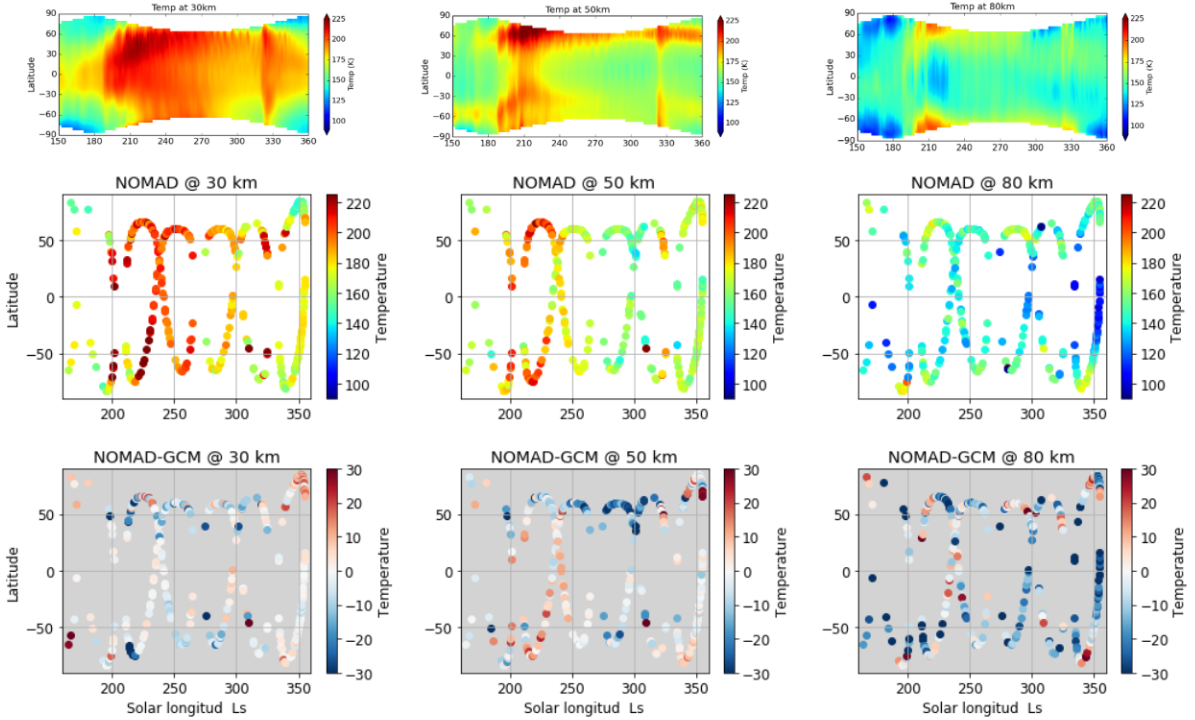
Temperature latitude-solar longitude cross sections at 3 different altitudes, 30 km (left panels), 50 km (central column’s panels) and 80 km (right-hand panels). The retrieved temperatures are shown in the central row, while Latitude-Ls cross sections from the LMD-MGCM are shown in the top panel, for reference.
JGR (2022); https://doi.org/10.1029/2022JE007231
S. Aoki, A. C. Vandaele, F. Daerden, G. L. Villanueva, G. Liuzzi, R. T. Clancy, M. A. Lopez-Valverde, A. Brines, I. R. Thomas, L. Trompet, J. T. Erwin, L. Neary, S. Robert, A. Piccialli, J. A. Holmes, M. R. Patel, N. Yoshida, J. Whiteway, M. D. Smith, B. Ristic, G. Bellucci, J. J. Lopez-Moreno, A. A. Fedorova
We present water vapor vertical distributions on Mars retrieved from 3.5 years of solar occultation measurements by Nadir and Occultation for Mars Discovery onboard the ExoMars Trace Gas Orbiter, which reveal a strong contrast between aphelion and perihelion water climates. In equinox periods, most of water vapor is confined into the low-middle latitudes. In aphelion periods, water vapor sublimated from the northern polar cap is confined into very low altitudes—water vapor mixing ratios observed at the 0–5 km lower boundary of measurement decrease by an order of magnitude at the approximate altitudes of 15 and 30 km for the latitudes higher than 50°N and 30–50°N, respectively. The vertical confinement of water vapor at northern middle latitudes around aphelion is more pronounced in the morning terminators than evening, perhaps controlled by the diurnal cycle of cloud formation. Water vapor is also observed over the low latitude regions in the aphelion southern hemisphere (0–30°S) mostly below 10–20 km, which suggests north-south transport of water still occurs. In perihelion periods, water vapor sublimated from the southern polar cap directly reaches high altitudes (>80 km) over high southern latitudes, suggesting more effective transport by the meridional circulation without condensation. We show that heating during perihelion, sporadic global dust storms, and regional dust storms occurring annually around 330° of solar longitude (LS) are the main events to supply water vapor to the upper atmosphere above 70 km.
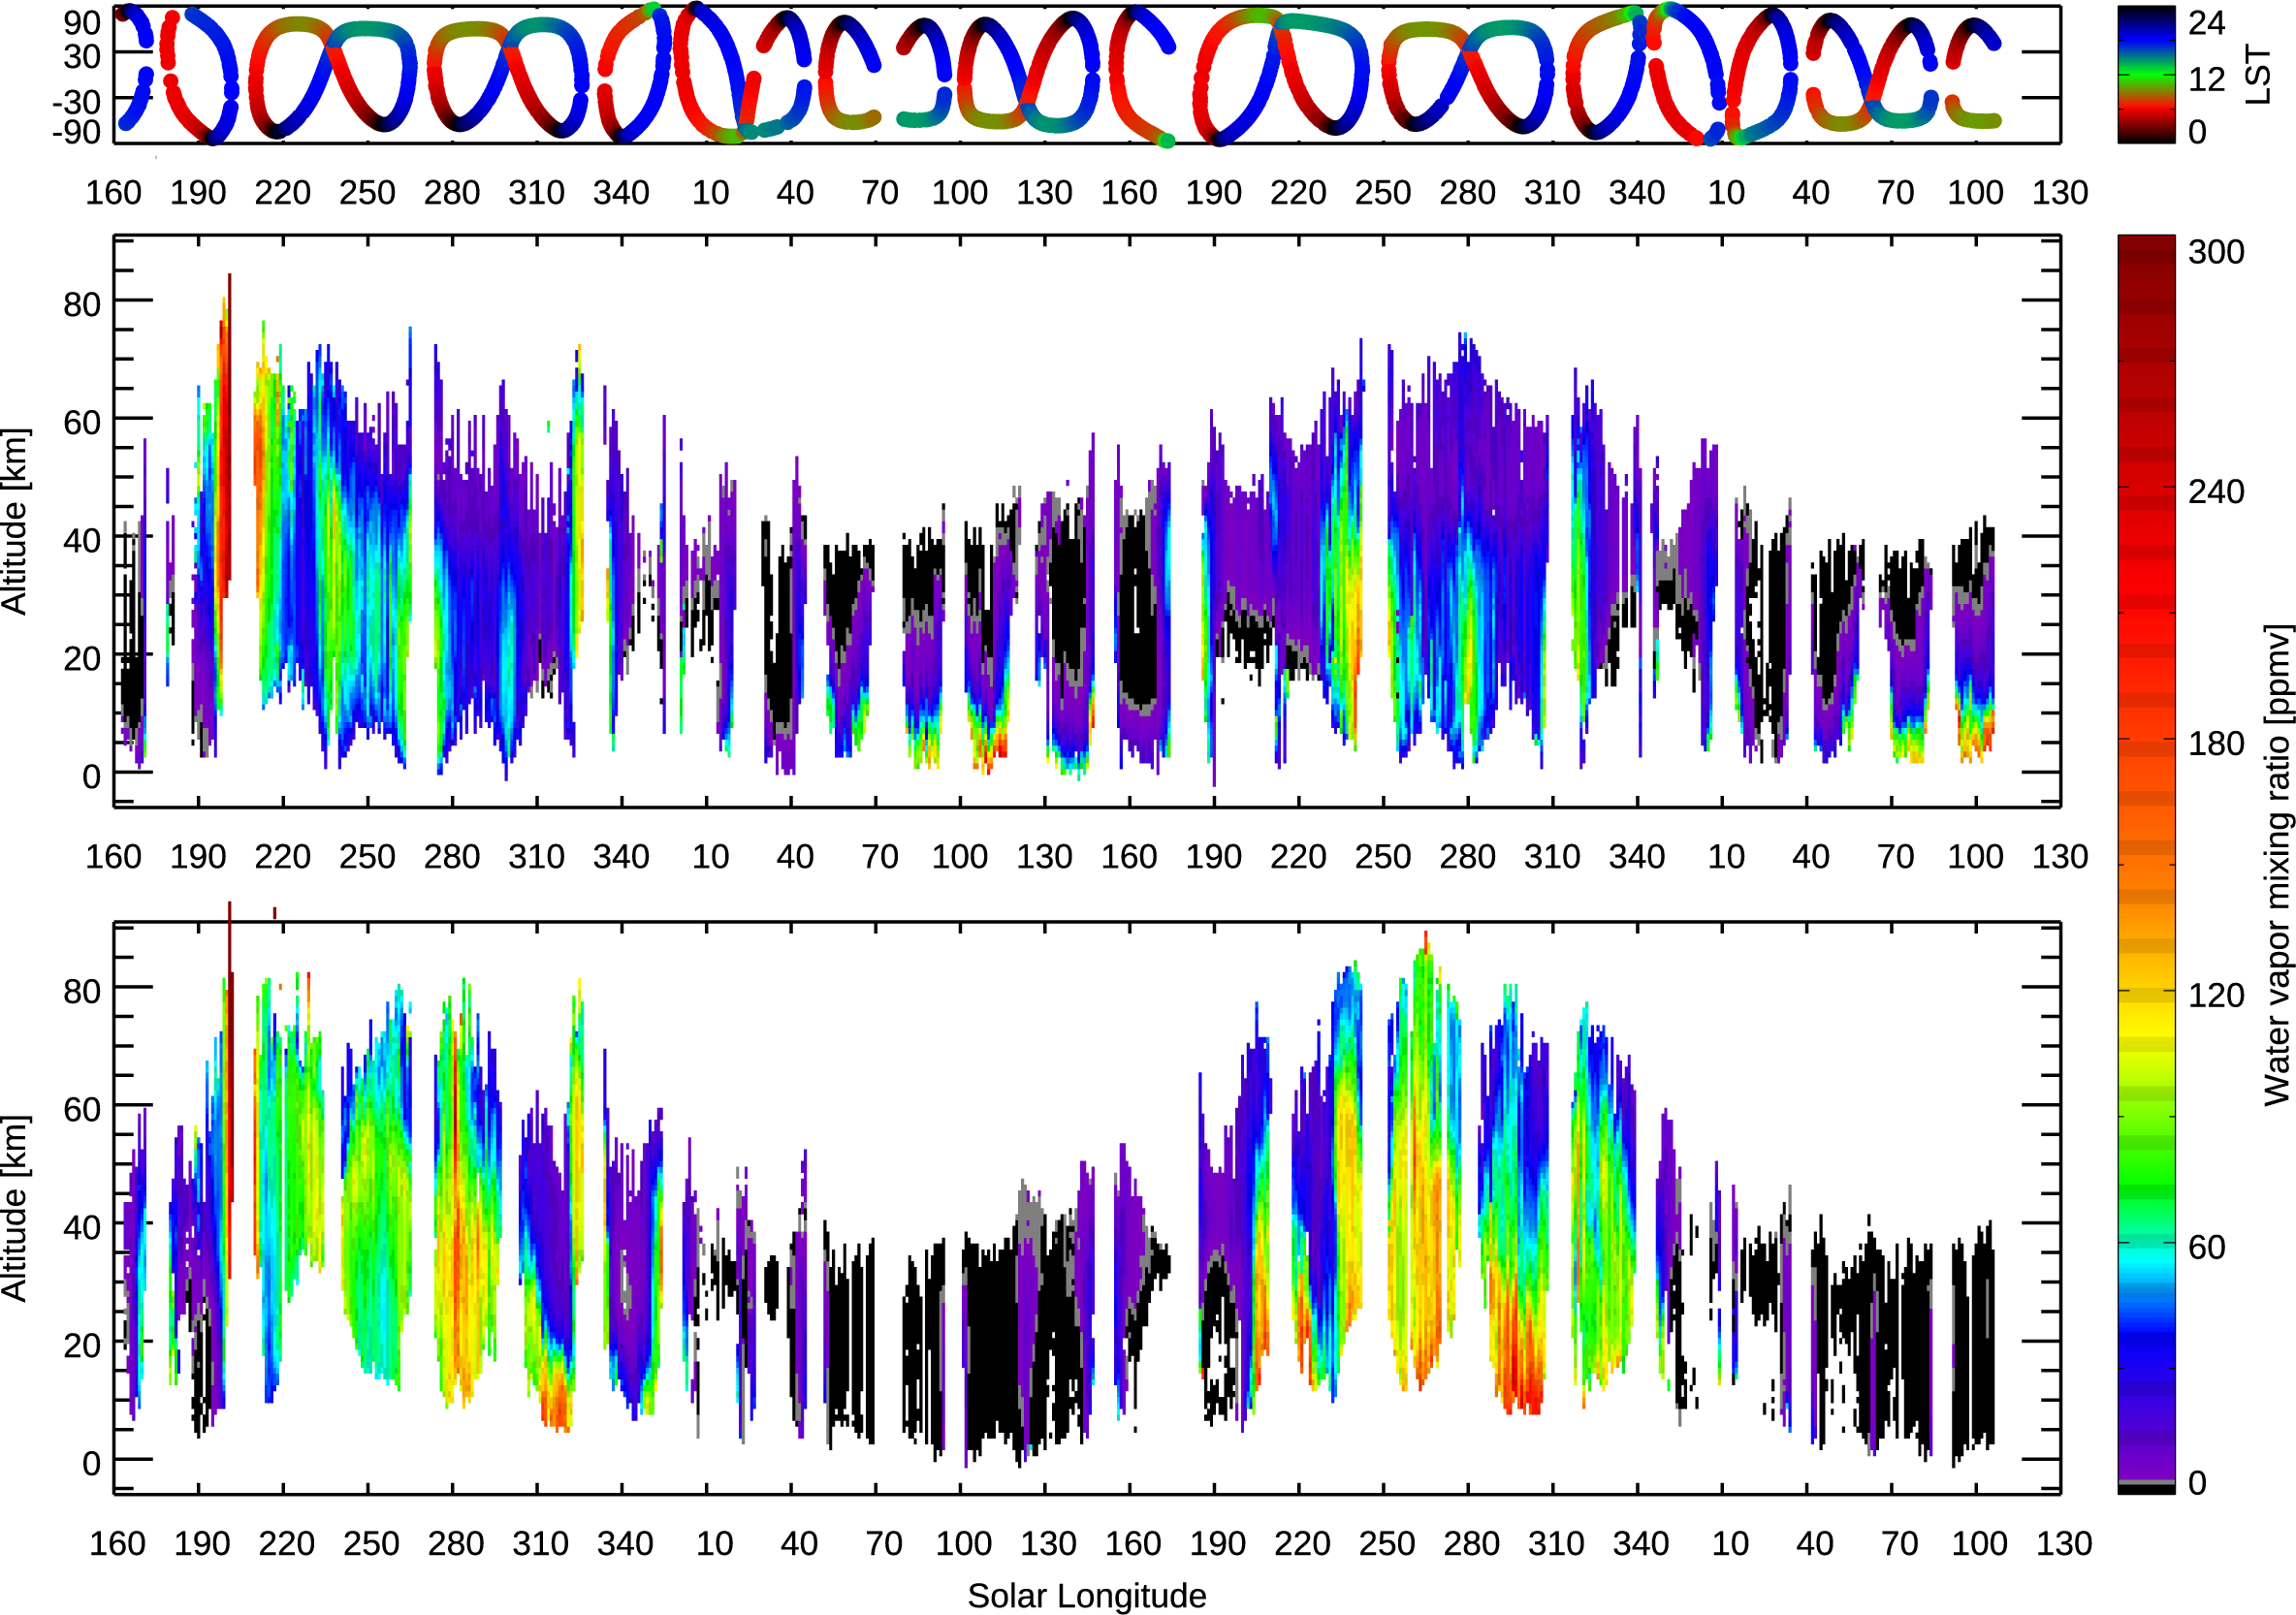
Seasonal variation of the water vapor vertical profiles from LS=160° in MY 34 to LS=130° in MY 36 retrieved from the NOMAD data in the northern hemisphere (the middle panel) and the southern hemisphere (the bottom panel). The retrievals are binned with an interval of 1° of solar longitudes (averaged in latitudes and longitude). The top panel shows the latitudes and local solar time of the measurements (same as Fig. 1). The white represents either no detection or no measurement.
Remote Sens (2022); https://doi.org/10.3390/rs14174143
Luca Ruiz Lozano, Özgür Karatekin, Véronique Dehant, Giancarlo Bellucci, Fabrizio Oliva, Emiliano D’Aversa, Filippo Giacomo Carrozzo, Francesca Altieri, Ian R. Thomas, Yannick Willame, Séverine Robert, Ann Carinne Vandaele, Frank Daerden, Bojan Ristic, Manish R. Patel and José Juan López Moreno
As part of the payload of the 2016 ExoMars Trace Gas Orbiter (TGO) mission, the Nadir and Occultation for MArs Discovery (NOMAD) suite instrument has been observing the Martian atmosphere since March 2018. NOMAD is mainly dedicated to the study of trace atmospheric species taking advantage of a high-spectral resolution. We demonstrate that when NOMAD is observing in nadir mode, i.e., when the line-of-sight points to the centre of Mars, it can be also exploited to detect ice. In this study we present a method based on the investigation of nadir observations of the NOMAD infrared channel, acquired during Mars Years 34 and 35 (March 2018 to February 2021). We take advantage of the strong water ice absorption band at 2.7 µm by selecting the diffraction orders 167, 168, and 169. We derive the Frost and Clouds Index (FCI), which is a good proxy for ice mapping, and obtain latitudinal-seasonal maps for water ice clouds. FCI is sensitive to the Polar Hood clouds. Nevertheless, detections in the Aphelion Cloud Belt (ACB) are limited. This is consistent with previous observations showing different physical properties between the two main Martian atmospheric structures and making the ACB less detectable in the infrared. We hence derive the infrared nadir channel sensitivity limit for the detection of these clouds.
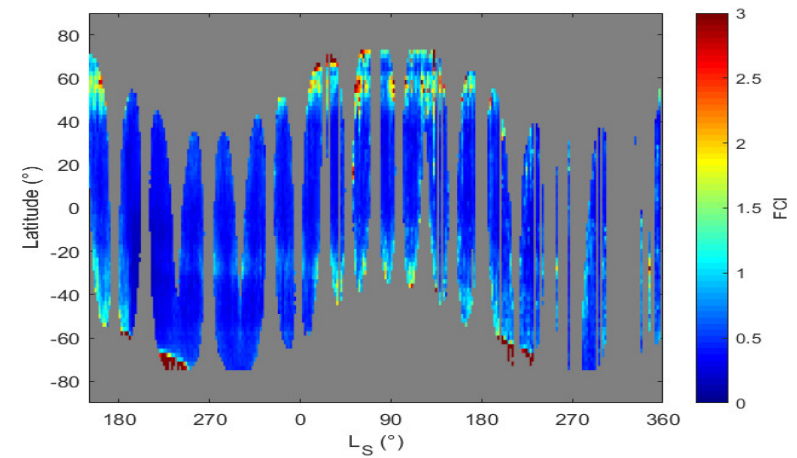
Latitudinal-seasonal map of FCI (frost-cloud index). Observations cover MY34, from LS = 150◦ to 360◦, and all MY35
GRL (2022) https://doi.org/10.1029/2022GL098161
Geronimo L. Villanueva, Giuliano Liuzzi, Shohei Aoki, Shane W. Stone, Adrian Brines, Ian R. Thomas, Miguel Angel Lopez-Valverde, Loic Trompet, Justin Erwin, Frank Daerden, Bojan Ristic, Michael D. Smith, Michael J. Mumma, Sara Faggi, Vincent Kofman, Séverine Robert, Lori Neary, Manish Patel, Giancarlo Bellucci, J.-J. Lopez-Moreno, Ann Carine Vandaele
We report vertical profiles of water and D/H for one Martian year as measured with the TGO/NOMAD instrument. The observations were performed via solar occultation, providing water profiles up to ∼100 km and D/H up to ∼60 km, with a vertical resolution of 1–2 km. The measurements reveal dramatic variability of water and D/H over short timescales and with altitude and location on the planet. We investigated the release of seasonal water from the polar caps during southern and northern summer, by mapping water and its D/H near the polar regions. Above the hygropause, the D/H drops substantially below 2 VSMOW, and both seasonal polar caps show a consistent and enriched D/H of 5–7 VSMOW within the hygrosphere.
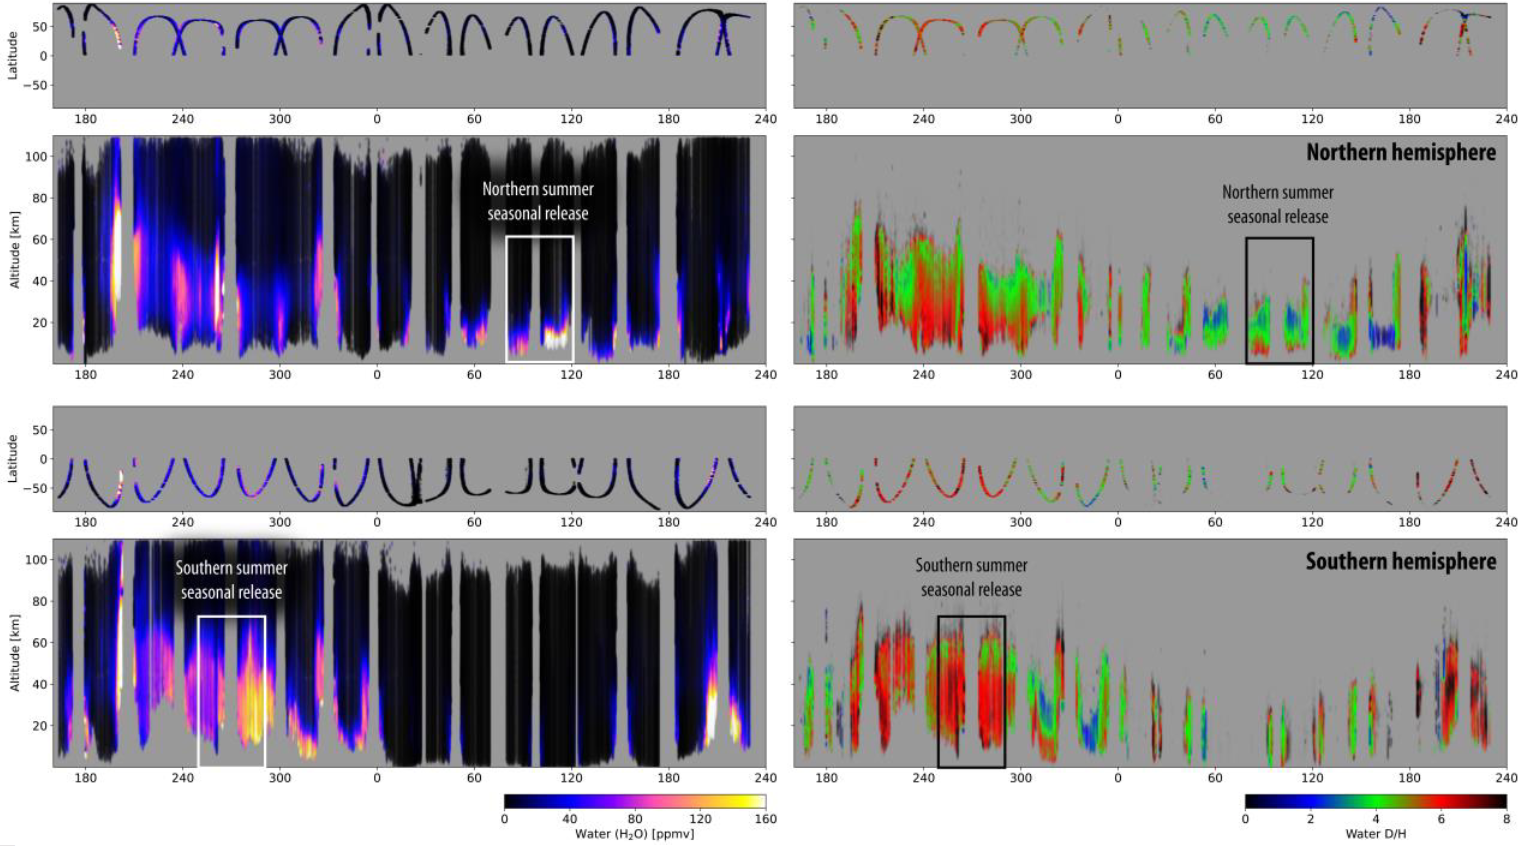
GRL (2022) https://doi.org/10.1029/2022GL098821
F. Daerden, L. Neary, M. J. Wolff, R. T. Clancy, F. Lefèvre, J. A. Whiteway, S. Viscardy, A. Piccialli, Y. Willame, C. Depiesse, S. Aoki, I. R. Thomas, B. Ristic, J. Erwin, J.-C. Gérard, B. J. Sandor, A. Khayat, M. D. Smith, J. P. Mason, M. R. Patel, G. L. Villanueva, G. Liuzzi, G. Bellucci, J.-J. Lopez-Moreno, A. C. Vandaele
The NOMAD/UVIS spectrometer on the ExoMars Trace Gas Orbiter provided observations of ozone and water vapor in the global dust storm of 2018. Here we show in detail, using advanced data filtering and chemical modeling, how Martian ozone in the middle atmosphere was destroyed during the dust storm. In data taken exactly one year later when no dust storm occurred, the normal situation had been reestablished. The model simulates how water vapor is transported to high altitudes and latitudes in the storm, where it photolyses to form odd hydrogen species that catalyze ozone. Ozone destruction is simulated at all latitudes and up to 100 km, except near the surface where it increases. The simulations also predict a strong increase in the photochemical production of atomic hydrogen in the middle atmosphere, consistent with the enhanced hydrogen escape observed in the upper atmosphere during global dust storms.
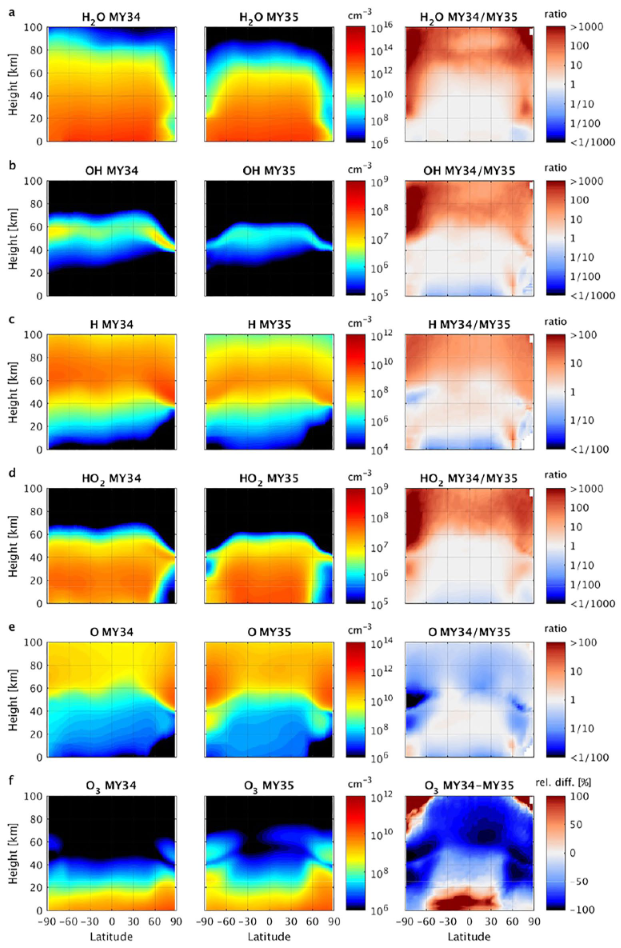
Latitude-height cross-sections of the simulated number densities of H2O, OH, H, HO2, O and O3 for MY34 (left column) and MY35 (center column), averaged over Ls = 210°–220° (period which falls in the global dust storm (GDS) in MY34). The right column show the ratio of the averaged number densities in MY34 and MY35, except for O3 for which the relative difference is shown. The densities from both years were first interpolated to a common altitude grid as the atmospheric height scale changed during the GDS.
PSS (2022) https://doi.org/10.1016/j.pss.2022.105504
Yannick Willame, Cédric Depiesse, Jonathon P. Mason, Ian R. Thomas, Manish R. Patel, Brijen Hathi, Mark R. Leese, David Bolsée, Michael J. Wolff, Loïc Trompet, Ann Carine Vandaele, Arianna Piccialli, Shohei Aoki, Bojan Ristic, Eddy Neefs, Bram Beeckman, Sophie Berkenbosch, Roland Clairquin, Arnaud Mahieux, Nuno Pereira, Séverine Robert, Sébastien Viscardy, Valérie Wilquet, Frank Daerden, José Juan Lopez-Moreno, Giancarlo Bellucci
The Ultraviolet and VIsible Spectrometer (UVIS), covering the 200–650 nm range, is one of three spectrometers that comprise the NOMAD instrument on the ExoMars 2016 Trace Gas Orbiter (TGO). UVIS can operate in solar occultation, nadir and limb viewing mode and was designed to monitor ozone and aerosols in the Martian atmosphere. Here, we describe the calibration procedure to convert the UVIS raw data into a calibrated data product ready for scientific exploitation. The calibration includes the CCD offset and dark current subtraction, the wavelength assignment, the noise identification and removal, the smearing removal, and the radiance or transmittance conversion. A straylight correction, critical for some parts of the UVIS spectral range, is also applied during the data reduction process, which is described in more detail in two companion papers [Mason et al., 2022; Depiesse et al., In prep] corresponding to two different and independent methods giving consistent results. The solar occultation observations are converted into transmittance and are therefore self-calibrating, while nadir and limb measurements require an absolute radiometric calibration. A comparison with coincident nadir MRO/MARCI measurements is provided as a final validation and generally shows a ±10% agreement on the radiances measured by both instruments.
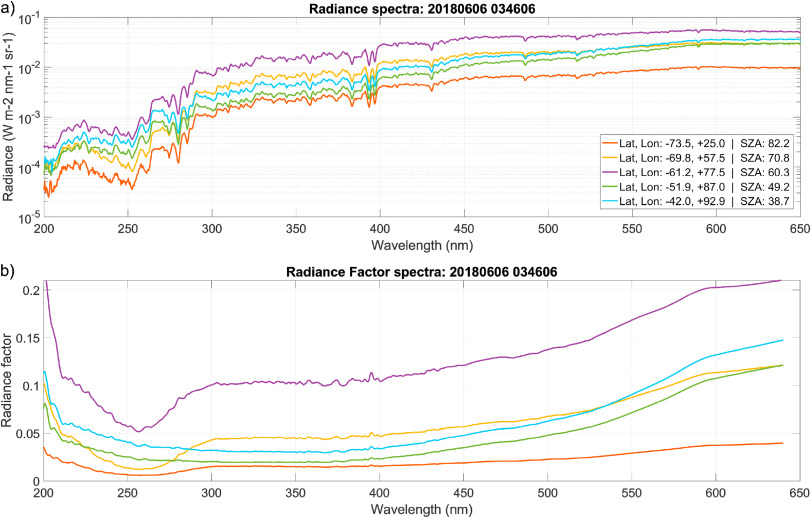
a) Example of radiance converted nadir spectra. Note the intensity difference between UV and the longer wavelength region that can reach more than 2 orders of magnitude. b) Same spectra as in the top panel but given as radiance factors. The characteristic absorption feature of the ozone Hartley band is visible between 220 and 290 nm at the polar latitudes below 60°S as expected at this period (Ls = 188.3°)
JGR Planets (2022) https://doi.org/10.1029/2022JE007220
L. Soret, J.-C. Gérard, S. Aoki, L. Gkouvelis, I. R. Thomas, B. Ristic, B. Hubert, Y. Willame, C. Depiesse, A.C. Vandaele, M. R. Patel, J. P. Mason, F. Daerden, J.-J. López-Moreno, G. Bellucci
The UVIS (UV and Visible Spectrometer) channel of the NOMAD (Nadir and Occultation for MArs Discovery) spectrometer aboard the ExoMars Trace Gas Orbiter has made limb observations of the Martian dayglow during more than a Martian year. Two pointing modes have been applied: (1) in the inertial mode, the spectrometer scans the atmosphere twice down to near the surface and provides altitude profiles of the dayglow; (2) in the tracking mode, the atmosphere is scanned at varying latitudes at a nearly constant altitude through the entire observation. We present a statistical study of the vertical and seasonal distribution of the recently discovered oxygen green and red lines at 557.7 nm and 630 nm. It indicates that the brightness of the green line emission responds to changes in the Lyman-α flux. The peak altitude of the green line emission increases seasonally when the Sun-Mars distance decreases. The lower peak of the green line statistically drops by 15-20 km between perihelion and aphelion at mid- to high altitude. The main lower peak intensity shows an asymmetry between the two hemispheres. It is significantly brighter and more pronounced in the southern hemisphere than in the north. This is a consequence of the stronger Lyman-α solar flux near perihelion. The second component of the oxygen red line at 636.4 nm is also detected for the first time in the Martian atmosphere. A photochemical model is used to simulate the variations of the green dayglow observed along limb tracking orbits.
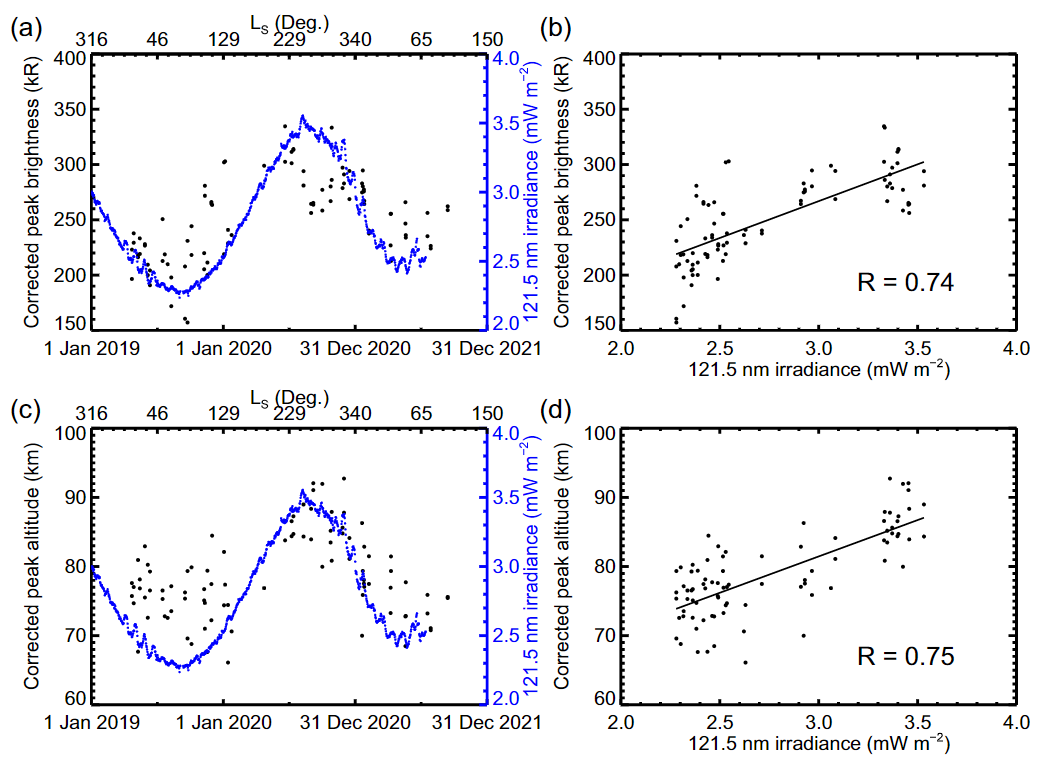
(a) Variation of the lower peak intensity of the oxygen green line along time (black dots). Intensities have been corrected from solar zenith angle (SZA) dependence. (b) A correlation with the Ly-α irradiance (blue dots) can be observed. (c) Variation of the lower peak altitude of the oxygen green line along time (black dots). Altitudes have been corrected from SZA dependence. (d) A clear correlation with the Ly-α irradiance (blue dots) can be observed.
JGR Planets (2022) https://doi.org/10.1029/2022JE007206
S. Aoki, L. Gkouvelis, J.-C. Gérard, L. Soret, B. Hubert, M. A. Lopez-Valverde, F. González-Galindo, H. Sagawa, I. R. Thomas, B. Ristic, Y. Willame, C. Depiesse, J. Mason, M. R. Patel, G. Bellucci, J.-J. Lopez-Moreno, F. Daerden, A. C. Vandaele
The upper mesosphere and lower thermosphere of Mars (70-150 km) is of high interest because it is a region affected by climatological/meteorological events in the lower atmosphere and external solar forcing. However, only a few measurements are available at this altitude range. OI 557.7 nm dayglow emission has been detected at these altitudes by the limb observations with Nadir and Occultation for Mars Discovery (NOMAD) aboard the ExoMars Trace Gas Orbiter (TGO). We develop an inversion method to retrieve density and temperature at these altitudes from the OI 557.7 nm dayglow limb profiles. We demonstrate that the atmospheric density around 90 and 140 km and temperature around 80 km during the daytime can be retrieved from the TGO/NOMAD limb measurements. The retrieved densities show a large seasonal variation both around 90 and 140 km and reach maximum values around perihelion period. This can be explained by temperature variation in the lower atmosphere driven by the dust content and Sun-Mars distance. Temperature around 80 km is higher than predicted by general circulation models, which is tentatively consistent with the warm atmospheric layer recently discovered in nighttime. The temperature retrieval relies on the temperature dependence of the quenching coefficient of 1S oxygen by CO2. Further validation of this coefficient in the range of the Mars upper atmosphere is needed for the verification of the retrieved high temperature.
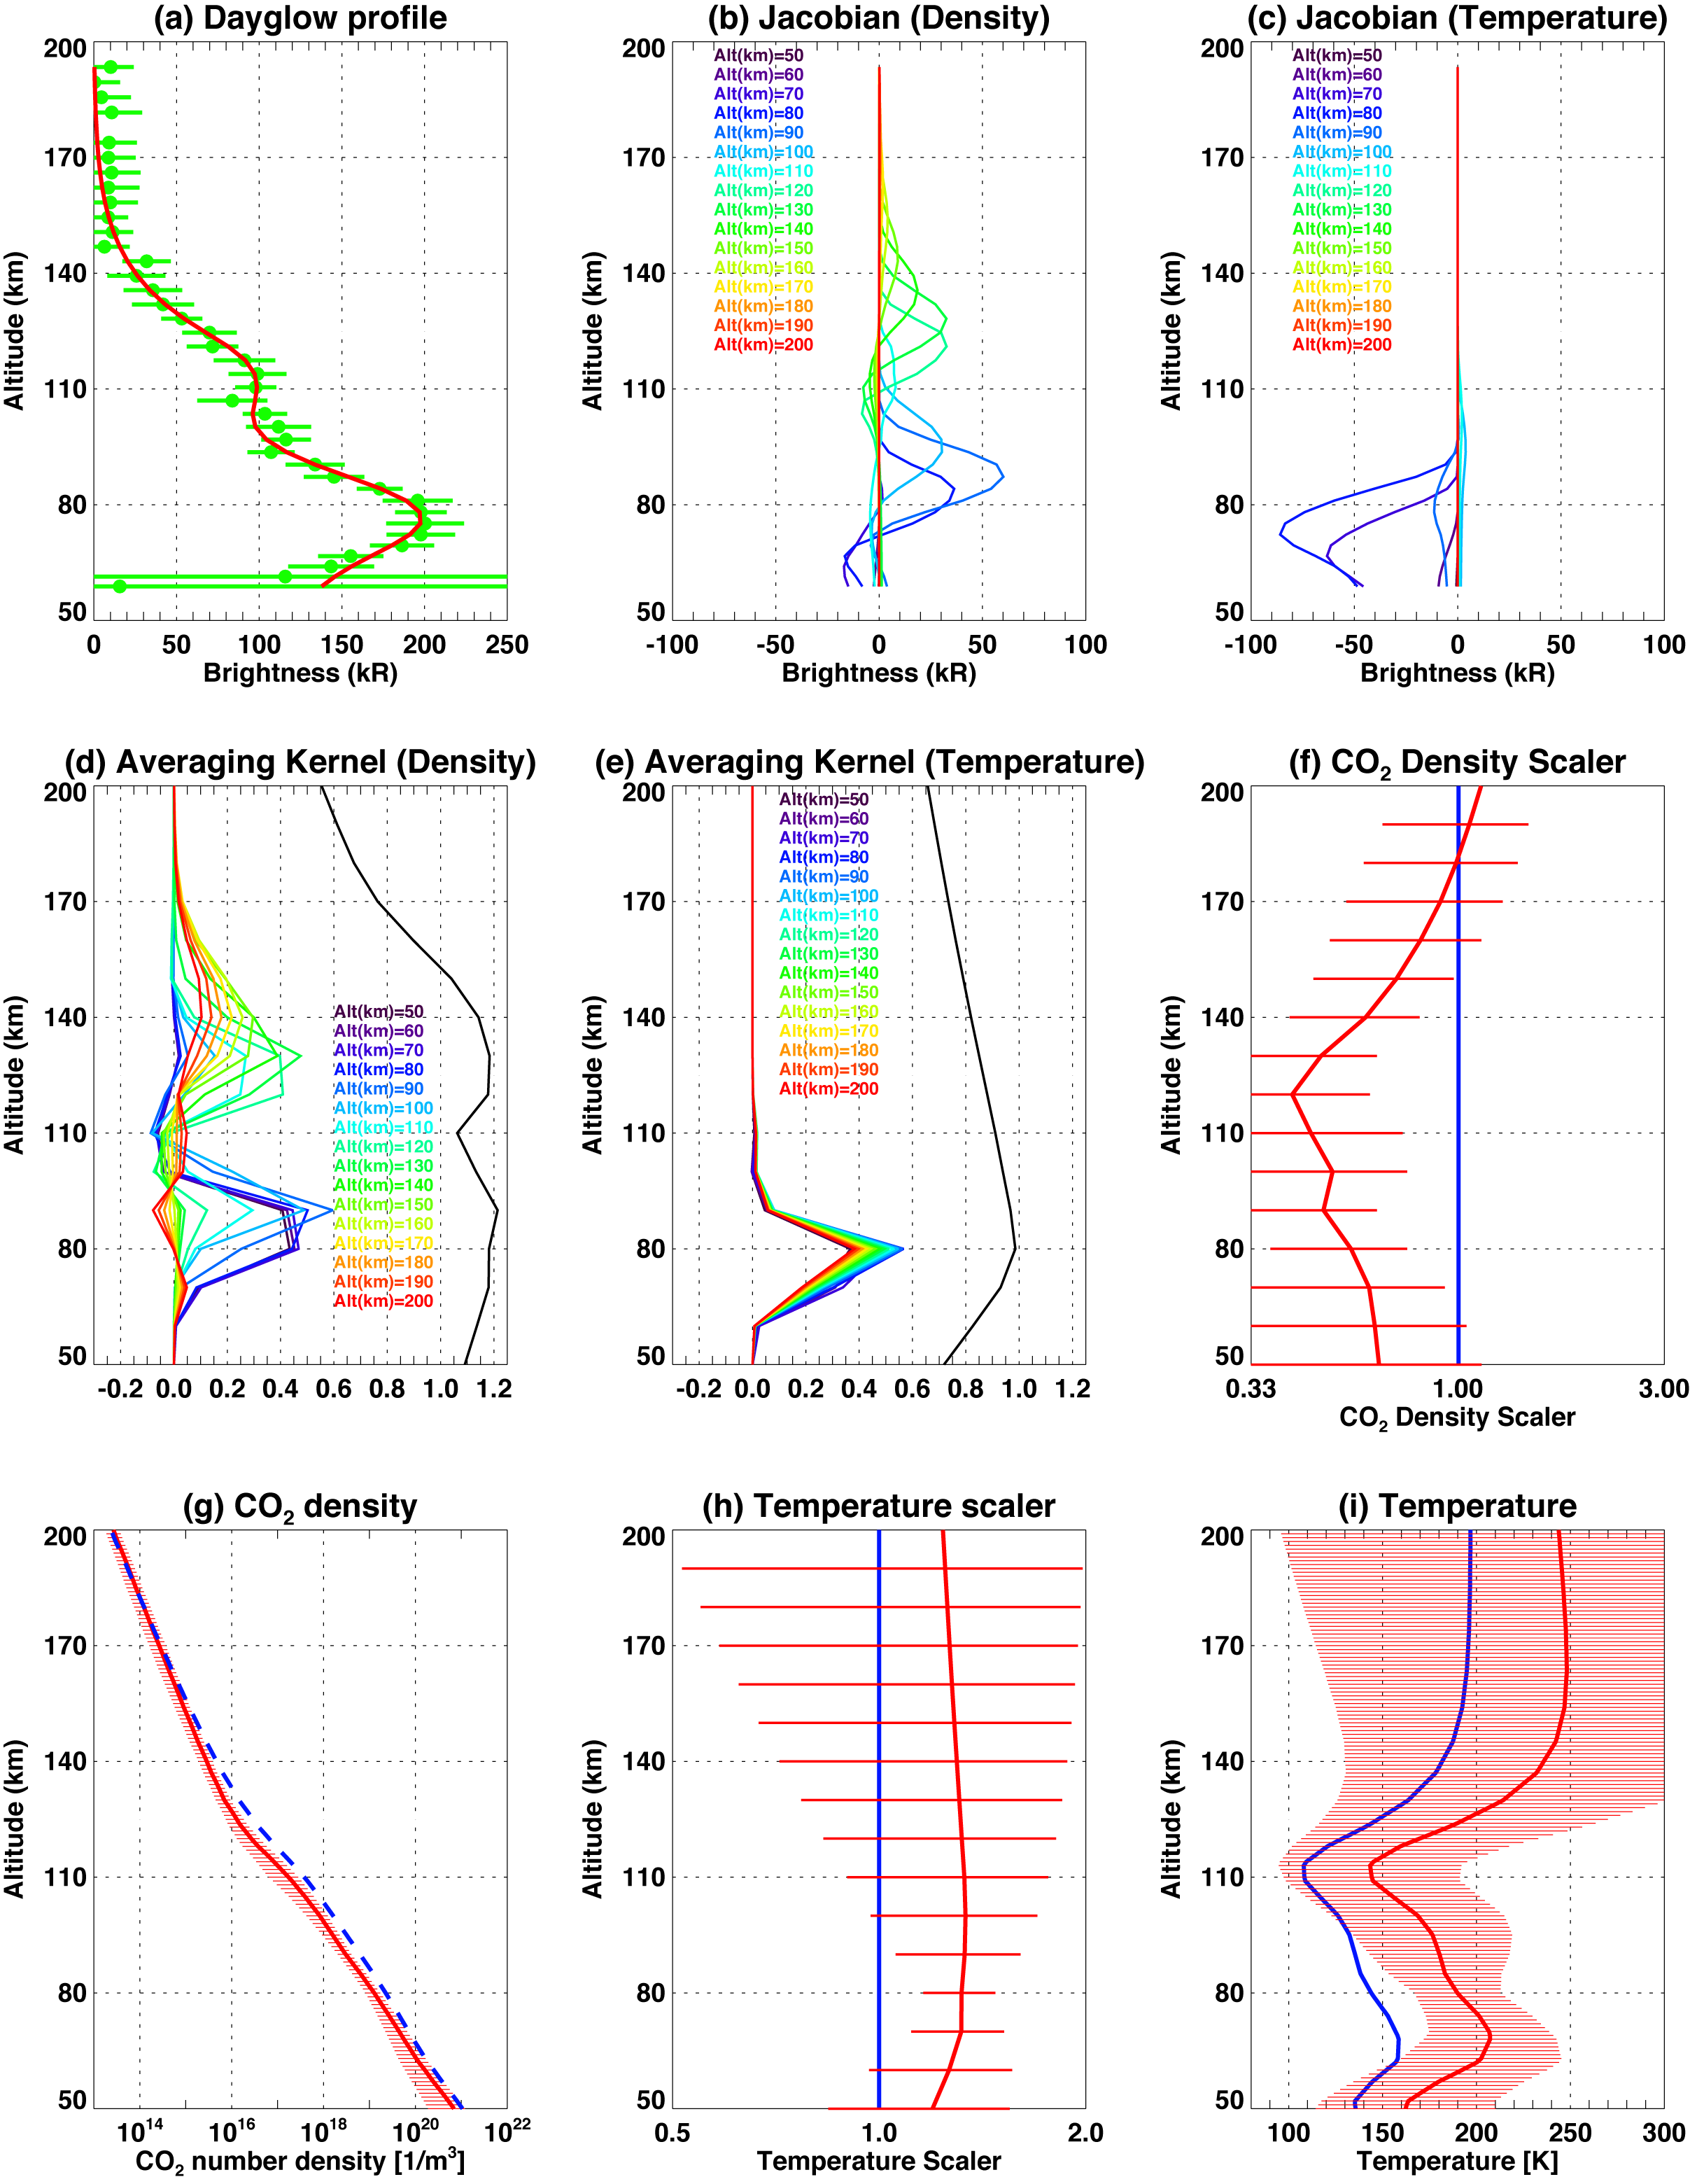
Example of the outputs from the retrieval analysis. (a) The vertical profiles of the OI dayglow brightness measured by NOMAD/UVIS and calculated by the model with the retrieved best-fit parameters (the red curve). (b) Jacobian matrix for density scaler. Each profile shows the sensitivity of the vertical profile of the dayglow brightnesswith respect to the CO2 density scaler for specific altitude (labelled in the legend). (c) Jacobian matrix for temperature scaler. (d) Averaging kernel matrix for density scaler. (e) Averaging kernel matrix for temperature scaler. Black curves in Figs. (d) and (e) present the total measurement response. (f) Retrieved CO2 density in the unit of scaler with 1-σ retrieval errors (red) relative tothe initial vertical profile given by MCD (blue). (g) Retrieved CO2 density in the unit of number density from NOMAD/UVIS (red), and the apriori CO2 number density given by MCD (blue). (h) Retrieved temperature in the unit of scaler. (i) Retrieved temperature in the unit of Kelvin from NOMAD/UVIS (red), and the a priori temperature given by MCD (blue).
GRL (2022) https://doi.org/10.1029/2022GL098485
Nao Yoshida, Hiromu Nakagawa, Shohei Aoki, Justin Erwin, Ann Carine Vandaele, Frank Daerden, Ian Thomas, Loïc Trompet, Shungo Koyama, Naoki Terada, Lori Neary, Isao Murata, Geronimo Villanueva, Giuliano Liuzzi, Miguel Angel Lopez-Valverde, Adrian Brines, Ashimananda Modak, Yasumasa Kasaba, Bojan Ristic, Giancarlo Bellucci, José Juan López-Moreno, Manish Patel
Using the Nadir and Occultation for MArs Discovery instrument aboard Trace Gas Orbiter, we derived the CO/CO2 profiles between 75 and 105 km altitude with the equivalent width technique. The derived CO/CO2 profiles showed significant seasonal variations in the southern hemisphere with decreases near perihelion and increases near aphelion. The estimation of the CO/CO2 profiles with a one-dimensional photochemical model shows that an altitude-dependent eddy diffusion coefficient better reproduces the observed profiles than a vertically-uniform one. Our estimation suggests that the eddy diffusion coefficient in Ls = 240 – 270 is uniformly larger by a factor of ∼2 than that in Ls = 90 – 120 in the southern hemisphere, while they are comparable in the northern hemisphere. This fact demonstrates that the eddy diffusion coefficient is variable with season and latitude.
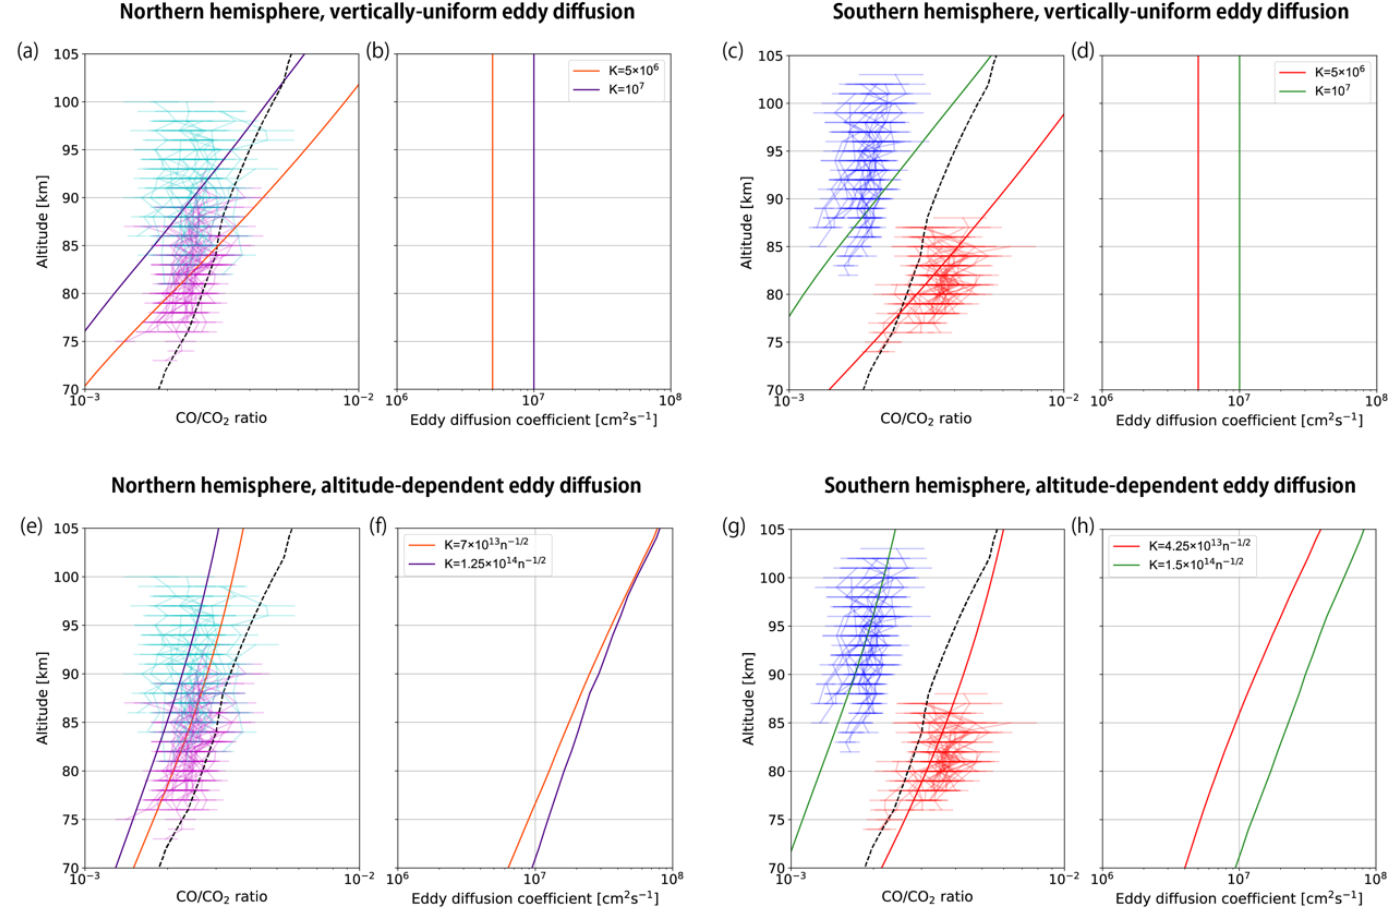
(a, c, e, and g) Vertical profiles of the CO/CO2ratio estimated with the 1D model and observed by NOMAD SO. The broken lines represent the initial CO/CO2profiles in the model. For the northern (southern) hemisphere, the observed CO/CO2 profiles in Ls= 240 –270 are shown in light blue (blue), and those in Ls= 90 –120 are in magenta(red).
(b, d, f, and h) The determined eddy diffusion coefficients by the 1D model. Profiles are distinguished by colors and divided into two hemispheres.
JGR Planets (2022) https://doi.org/10.1029/2021JE007083
F. Oliva, E. D’Aversa, G. Bellucci, F. G. Carrozzo, L. Ruiz Lozano, F. Altieri, I. R. Thomas, O. Karatekin, G. Cruz Mermy, F. Schmidt, S. Robert, A. C. Vandaele, F. Daerden, B. Ristic, M. R. Patel, J.-J. López-Moreno, G. Sindoni
The Nadir and Occultation for MArs Discovery (NOMAD) instrument suite aboard ExoMars/Trace Gas Orbiter spacecraft is mainly conceived for the study of minor atmospheric species, but it also offers the opportunity to investigate surface composition and aerosols properties. We investigate the information content of the Limb, Nadir, and Occultation (LNO) infrared channel of NOMAD and demonstrate how spectral orders 169, 189, and 190 can be exploited to detect surface CO2 ice. We study the strong CO2 ice absorption band at 2.7 μm and the shallower band at 2.35 μm taking advantage of observations across Martian Years 34 and 35 (March 2018 to February 2020), straddling a global dust storm. We obtain latitudinal-seasonal maps for CO2 ice in both polar regions, in overall agreement with predictions by a general climate model and with the Mars Express/OMEGA spectrometer Martian Years 27 and 28 observations. We find that the narrow 2.35 μm absorption band, spectrally well covered by LNO order 189, offers the most promising potential for the retrieval of CO2 ice microphysical properties. Occurrences of CO2 ice spectra are also detected at low latitudes and we discuss about their interpretation as daytime high altitude CO2 ice clouds as opposed to surface frost. We find that the clouds hypothesis is preferable on the basis of surface temperature, local time and grain size considerations, resulting in the first detection of CO2 ice clouds through the study of this spectral range. Through radiative transfer considerations on these detections we find that the 2.35 μm absorption feature of CO2 ice clouds is possibly sensitive to nm-sized ice grains.
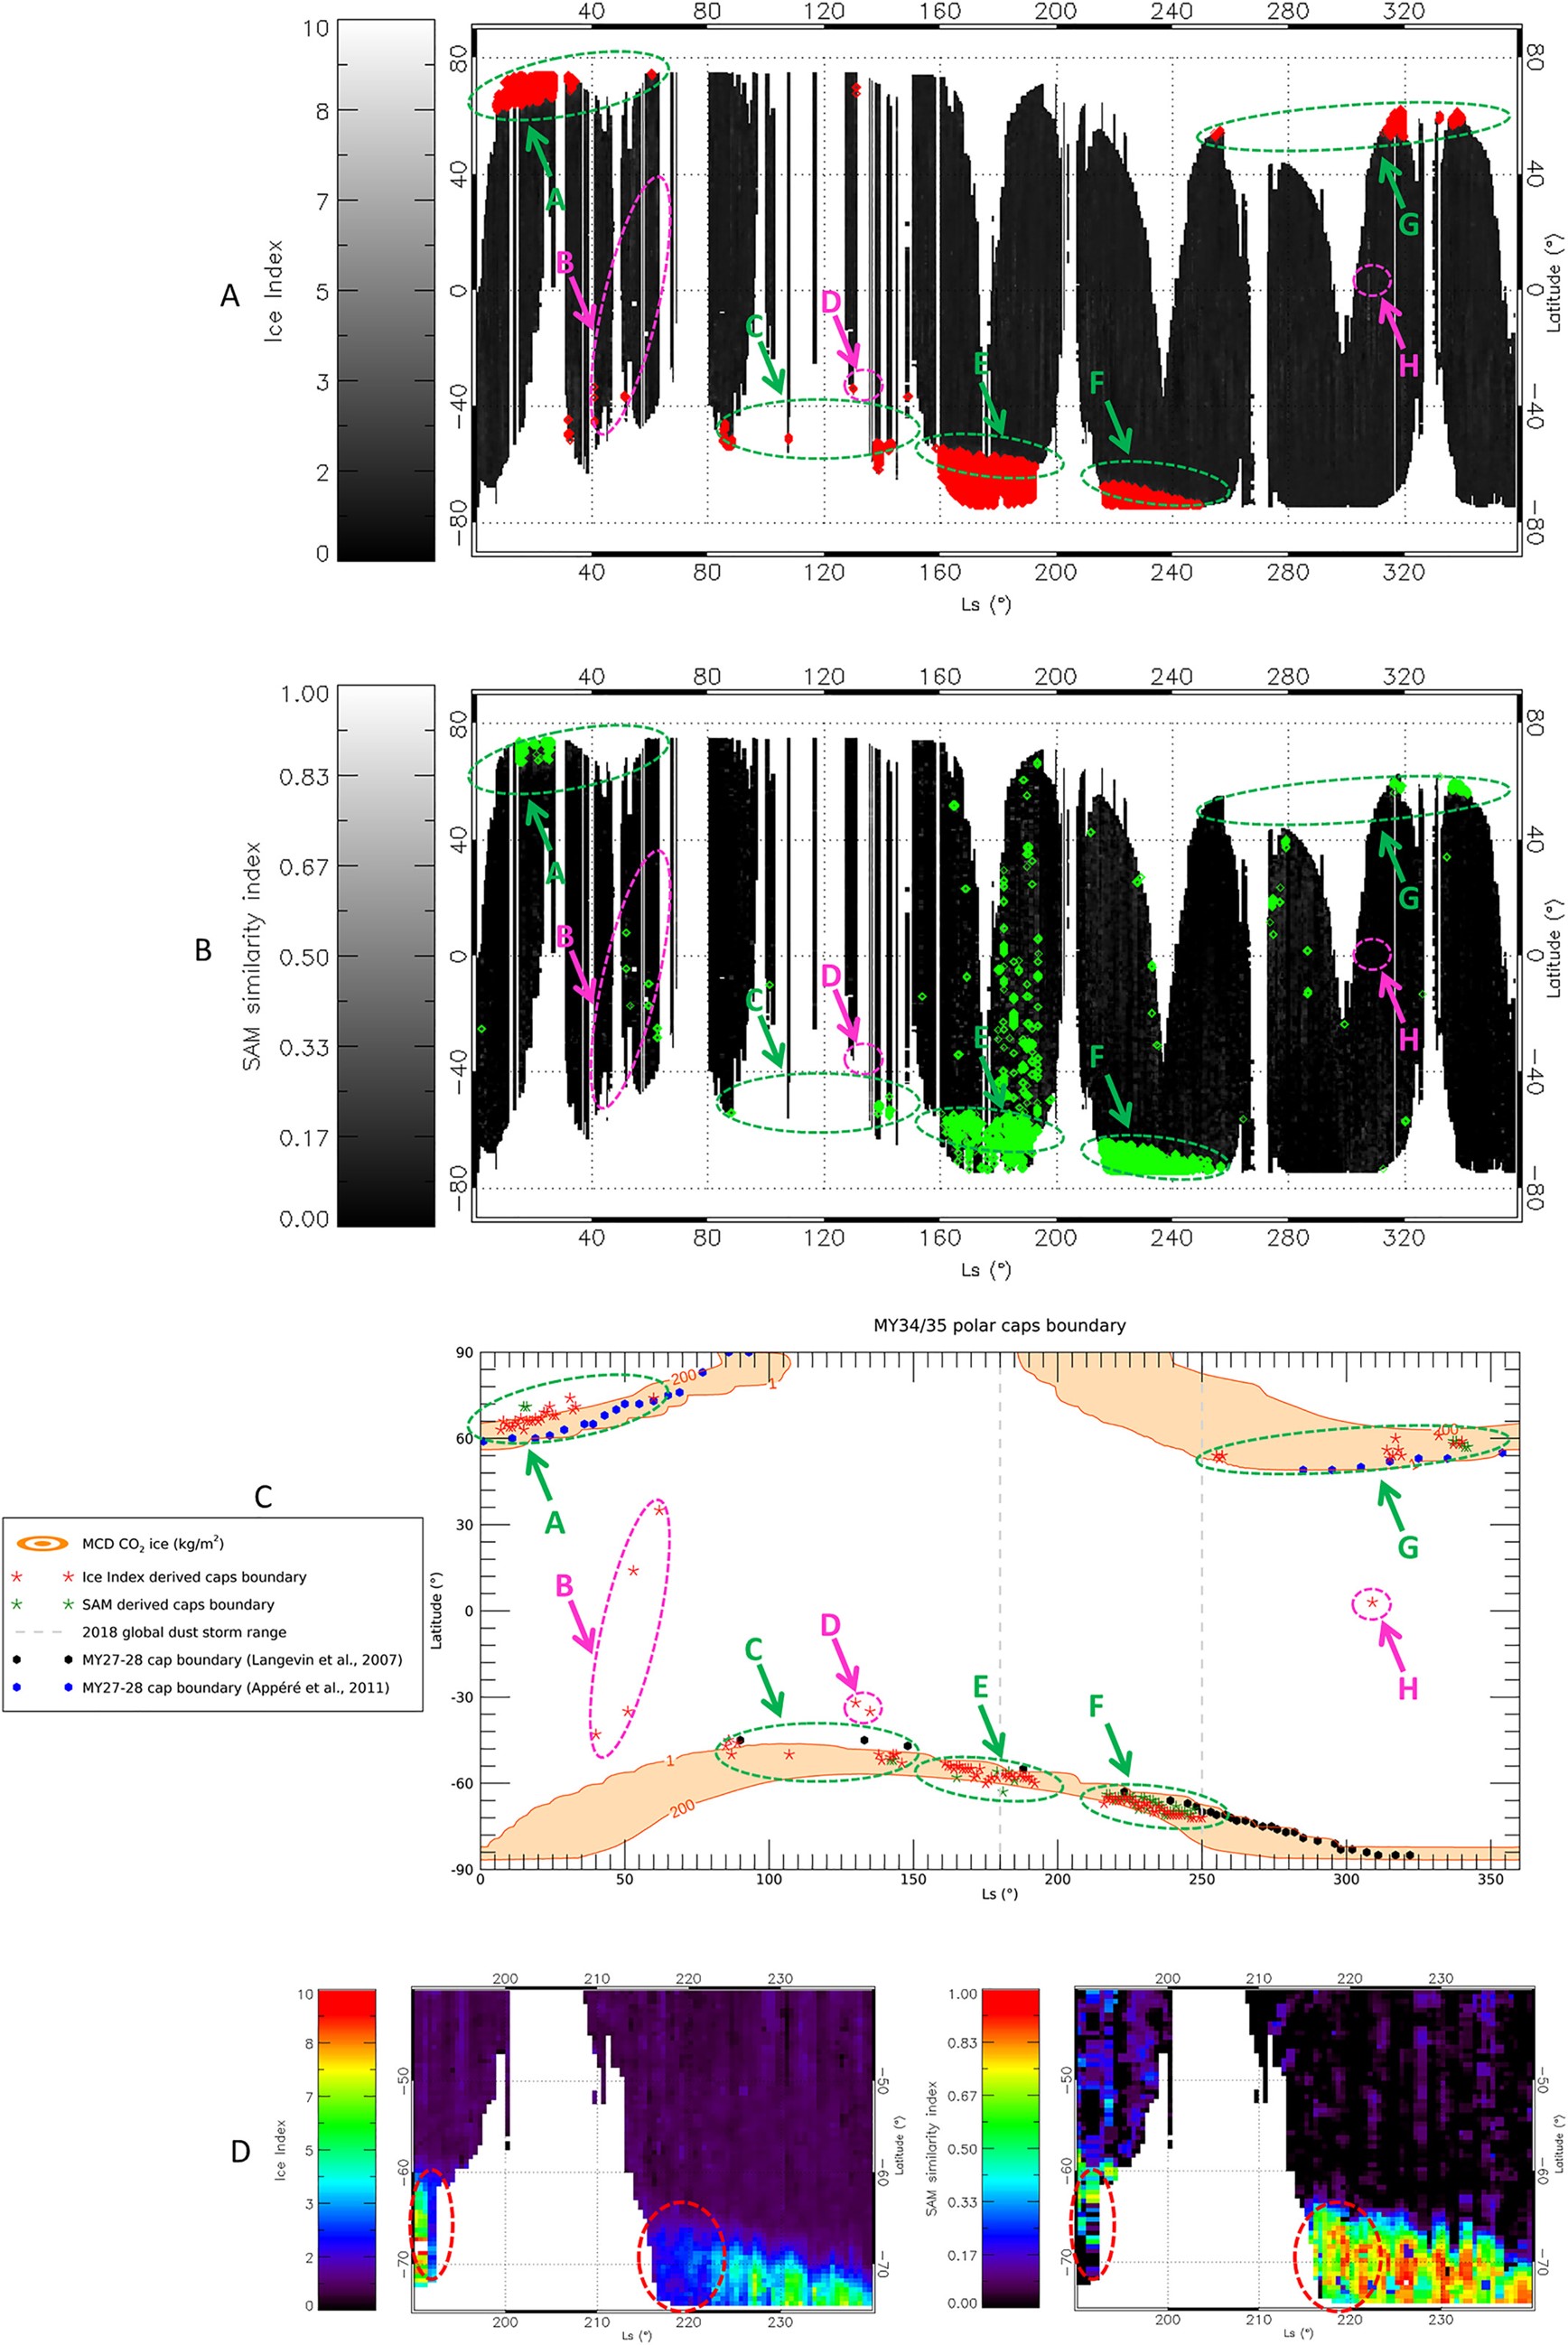
In all panels, Ls between 0° and 150° refer to MY35, while Ls between 150° and 360° are related to MY34. Panels (a and b) Ice Index (a) and Spectral Angle Mapper (SAM) χ (b) maps where red and green points indicate regions with Ice Index >2 and SAM index χ >0.2 respectively (see Section 4.1 and Section 4.2). Colored labeled arrows indicate structures of interest identified in panel (c), on the polar caps (green) and at mid-latitudes (magenta, Section 5.1). Panel (c) red and green stars indicate the polar caps boundaries estimated through Ice Index and SAM similarity index χ respectively (Section 5). These are compared to the MCD simulated abundances of CO2 ice corresponding to the observed cap boundaries positions (orange regions, representing surface column mass densities in kg/m2) and to OMEGA observations (black and blue dots for the South and North poles respectively) from MY27-28 (Appéré et al., 2011; Langevin et al., 2007). The dashed gray lines indicate the 2018 global dust storm Ls range. Panel (d) comparison of the South polar cap in the Ice Index and SAM χ index maps within the storm Ls range. The red dashed circles indicate regions in which the dust storm strongly impacts the Ice Index value.
JGR Planets (2022) https://doi.org/10.1029/2021JE007065
Paul M. Streeter, Graham Sellers, Michael J. Wolff, Jonathon P. Mason, Manish R. Patel, Stephen R. Lewis, James A. Holmes, Frank Daerden, Ian R. Thomas, Bojan Ristic, Yannick Willame, Cédric Depiesse, Ann Carine Vandaele, Giancarlo Bellucci, José Juan López-Moreno
The vertical opacity structure of the martian atmosphere is important for understanding the distribution of ice (water and carbon dioxide) and dust. We present a new data set of extinction opacity profiles from the NOMAD/UVIS spectrometer aboard the ExoMars Trace Gas Orbiter, covering one and a half Mars Years (MY) including the MY 34 Global Dust Storm and several regional dust storms. We discuss specific mesospheric cloud features and compare with existing literature and a Mars Global Climate Model (MGCM) run with data assimilation. Mesospheric opacity features, interpreted to be water ice, were present during the global and regional dust events and correlate with an elevated hygropause in the MGCM, providing evidence that regional dust storms can boost transport of vapor to mesospheric altitudes (with potential implications for atmospheric escape). The season of the dust storms also had an apparent impact on the resulting lifetime of the cloud features, with events earlier in the dusty season correlating with longer-lasting mesospheric cloud layers. Mesospheric opacity features were also present during the dusty season even in the absence of regional dust storms, and interpreted to be water ice based on previous literature. The assimilated MGCM temperature structure agreed well with the UVIS opacities, but the MGCM opacity field struggled to reproduce mesospheric ice features, suggesting a need for further development of water ice parameterizations. The UVIS opacity data set offers opportunities for further research into the vertical aerosol structure of the martian atmosphere, and for validation of how this is represented in numerical models.
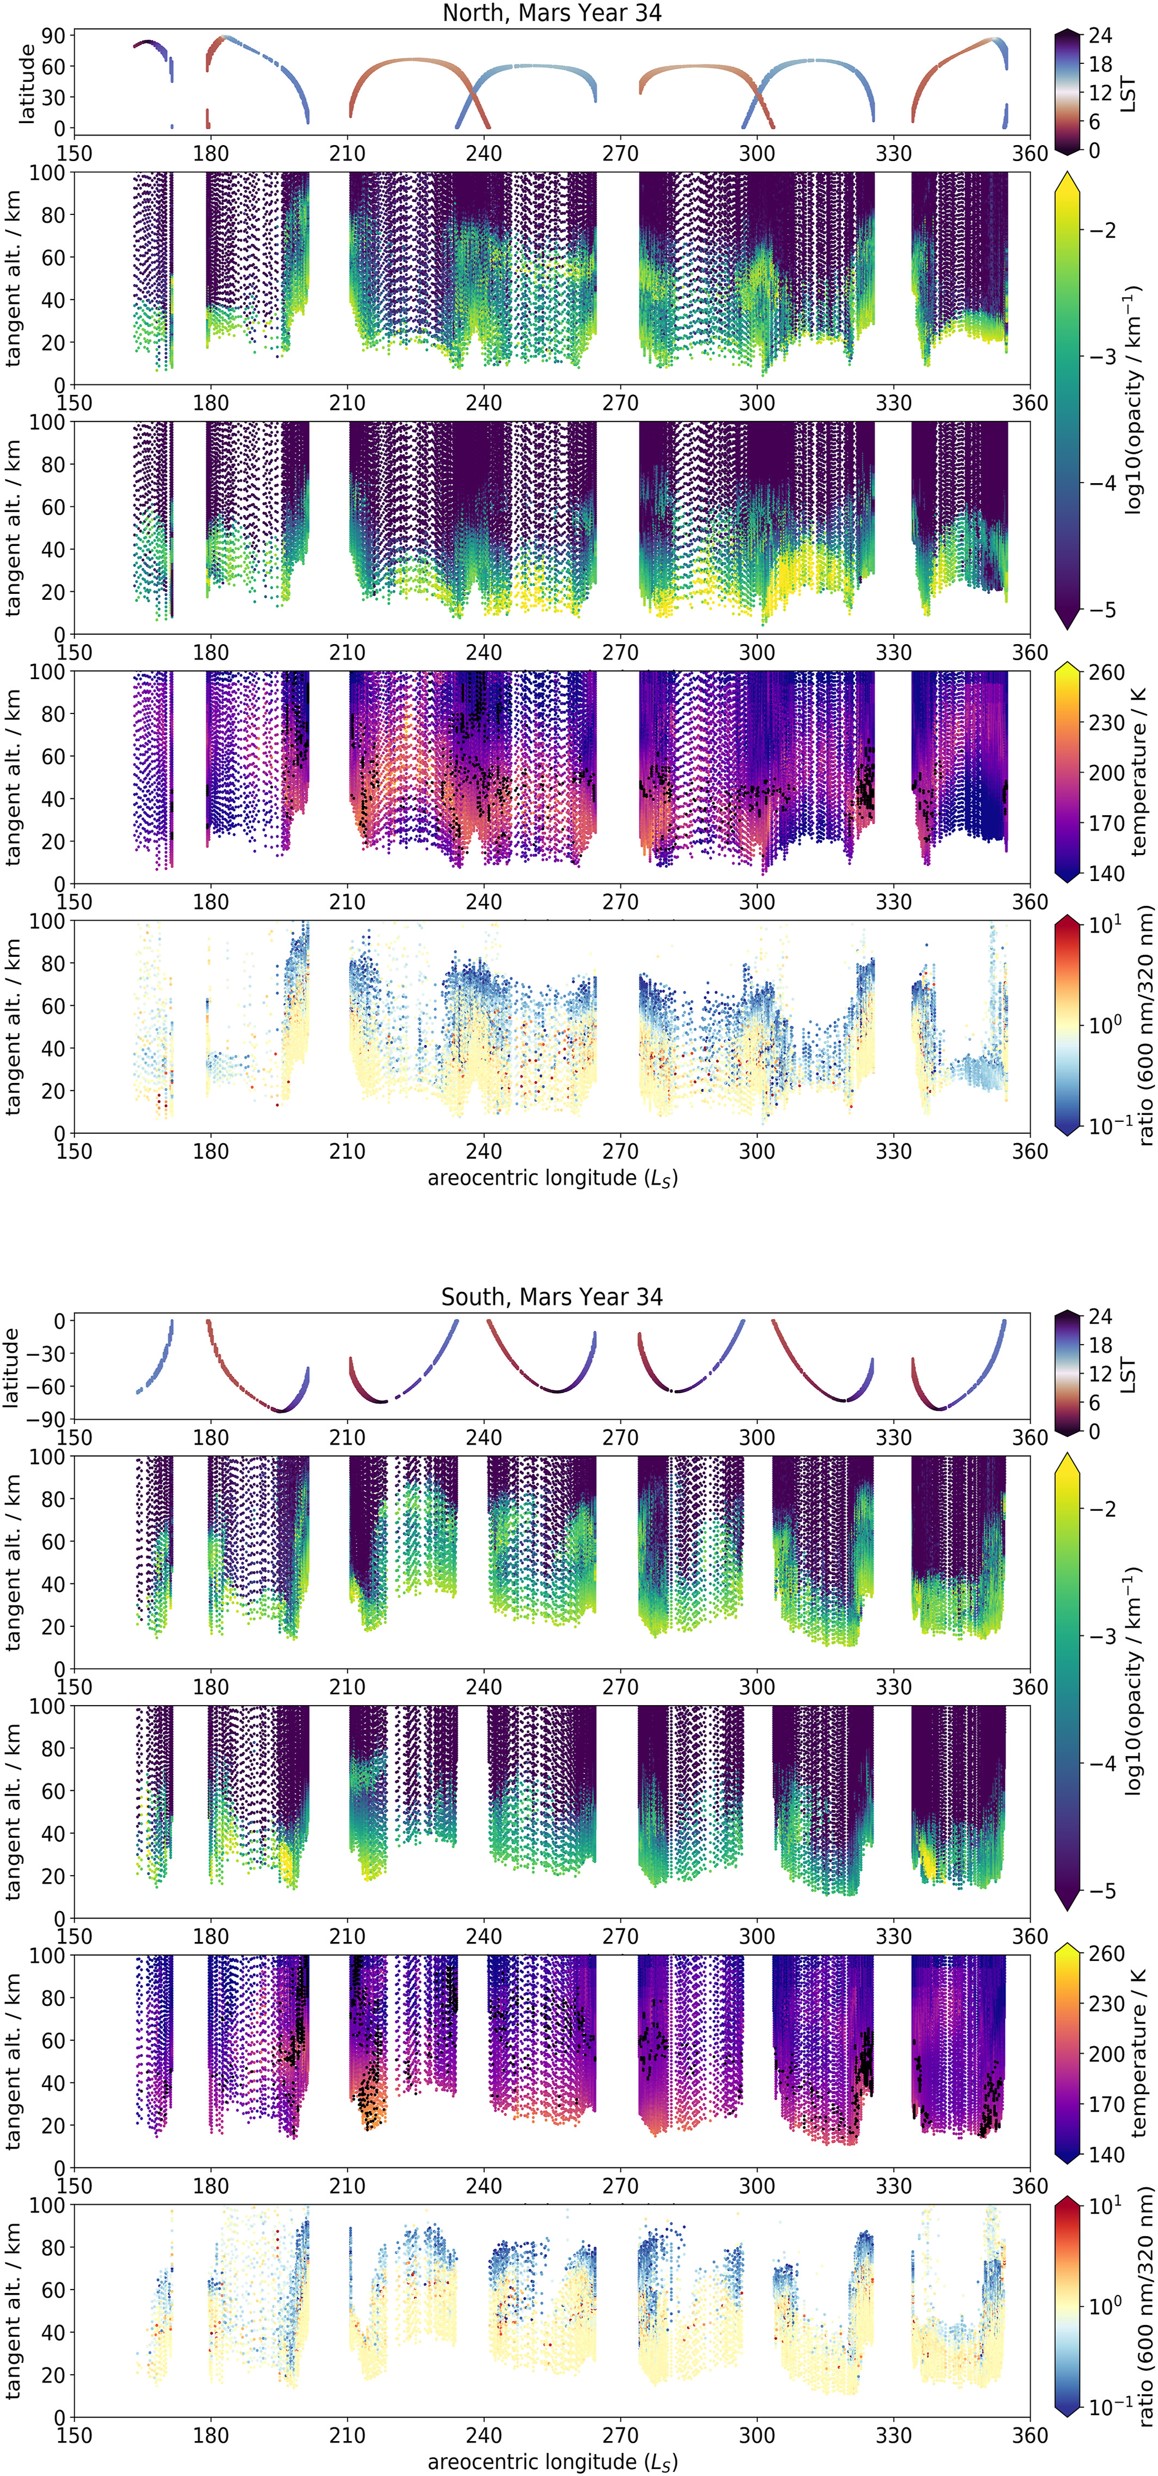
For MY 34 in the northern hemisphere (top five plots) and southern hemisphere (bottom five plots), from top to bottom: UVIS occultation latitude and local solar time distribution; UVIS occultation opacity profiles at 320–360 nm; total (dust + water ice) opacity profiles from the MGCM run with assimilation, matched to the same locations as the UVIS occultations; atmospheric temperatures from the MGCM run with assimilation, matched to the same locations as the UVIS occultations, and overlaid with black dots indicating the approximate location of the hygropause in the MGCM water vapor field, defined here as 70 ppmv (J. Holmes et al., 2021); ratio of UVIS occultation opacities at 600 nm over 320 nm.
JGR Planets (2022) https://doi.org/10.1029/2021JE007079
F. Daerden, L. Neary, G. Villanueva, G. Liuzzi, S. Aoki, R. T. Clancy, J. A. Whiteway, B. J. Sandor, M. D. Smith, M. J. Wolff, A. Pankine, A. Khayat, R. Novak, B. Cantor, M. Crismani, M. J. Mumma, S. Viscardy, J. Erwin, C. Depiesse, A. Mahieux, A. Piccialli, S. Robert, L. Trompet, Y. Willame, E. Neefs, I. R. Thomas, B. Ristic, A. C. Vandaele
The vertical profiles of water vapor and its semi-heavy hydrogen isotope HDO provided by instruments on ExoMars Trace Gas Orbiter constitute a unique new data set to understand the Martian water cycle including its isotopic composition. As water vapor undergoes hydrogen isotopic fractionation upon deposition (but not sublimation), the D/H isotopic ratio in water is a tracer of phase transitions, and a key quantity to understand the long-term history of water on Mars. Here, we present 3D global simulations of D/H in water vapor and compare them to the vertically resolved observations of D/H and water ice clouds taken by NOMAD during the second half of Mars year 34. D/H is predicted to be constant with height up to the main cloud level, above which it drops because of strong fractionation, explaining the upper cut-off in the NOMAD observations when HDO drops below detectability. During the global and regional dust storms of 2018/2019, we find that HDO ascends with H2O, and that the D/H ratio is constant and detectable up to larger heights. The simulations are within the provided observational uncertainties over wide ranges in season, latitude and height. Our work provides evidence that the variability of the D/H ratio in the lower and middle atmosphere of Mars is controlled by fractionation on water ice clouds, and thus modulated by diurnally and seasonally varying cloud formation. We find no evidence of other processes or reservoirs that would have a significant impact on the D/H ratio in water vapor.
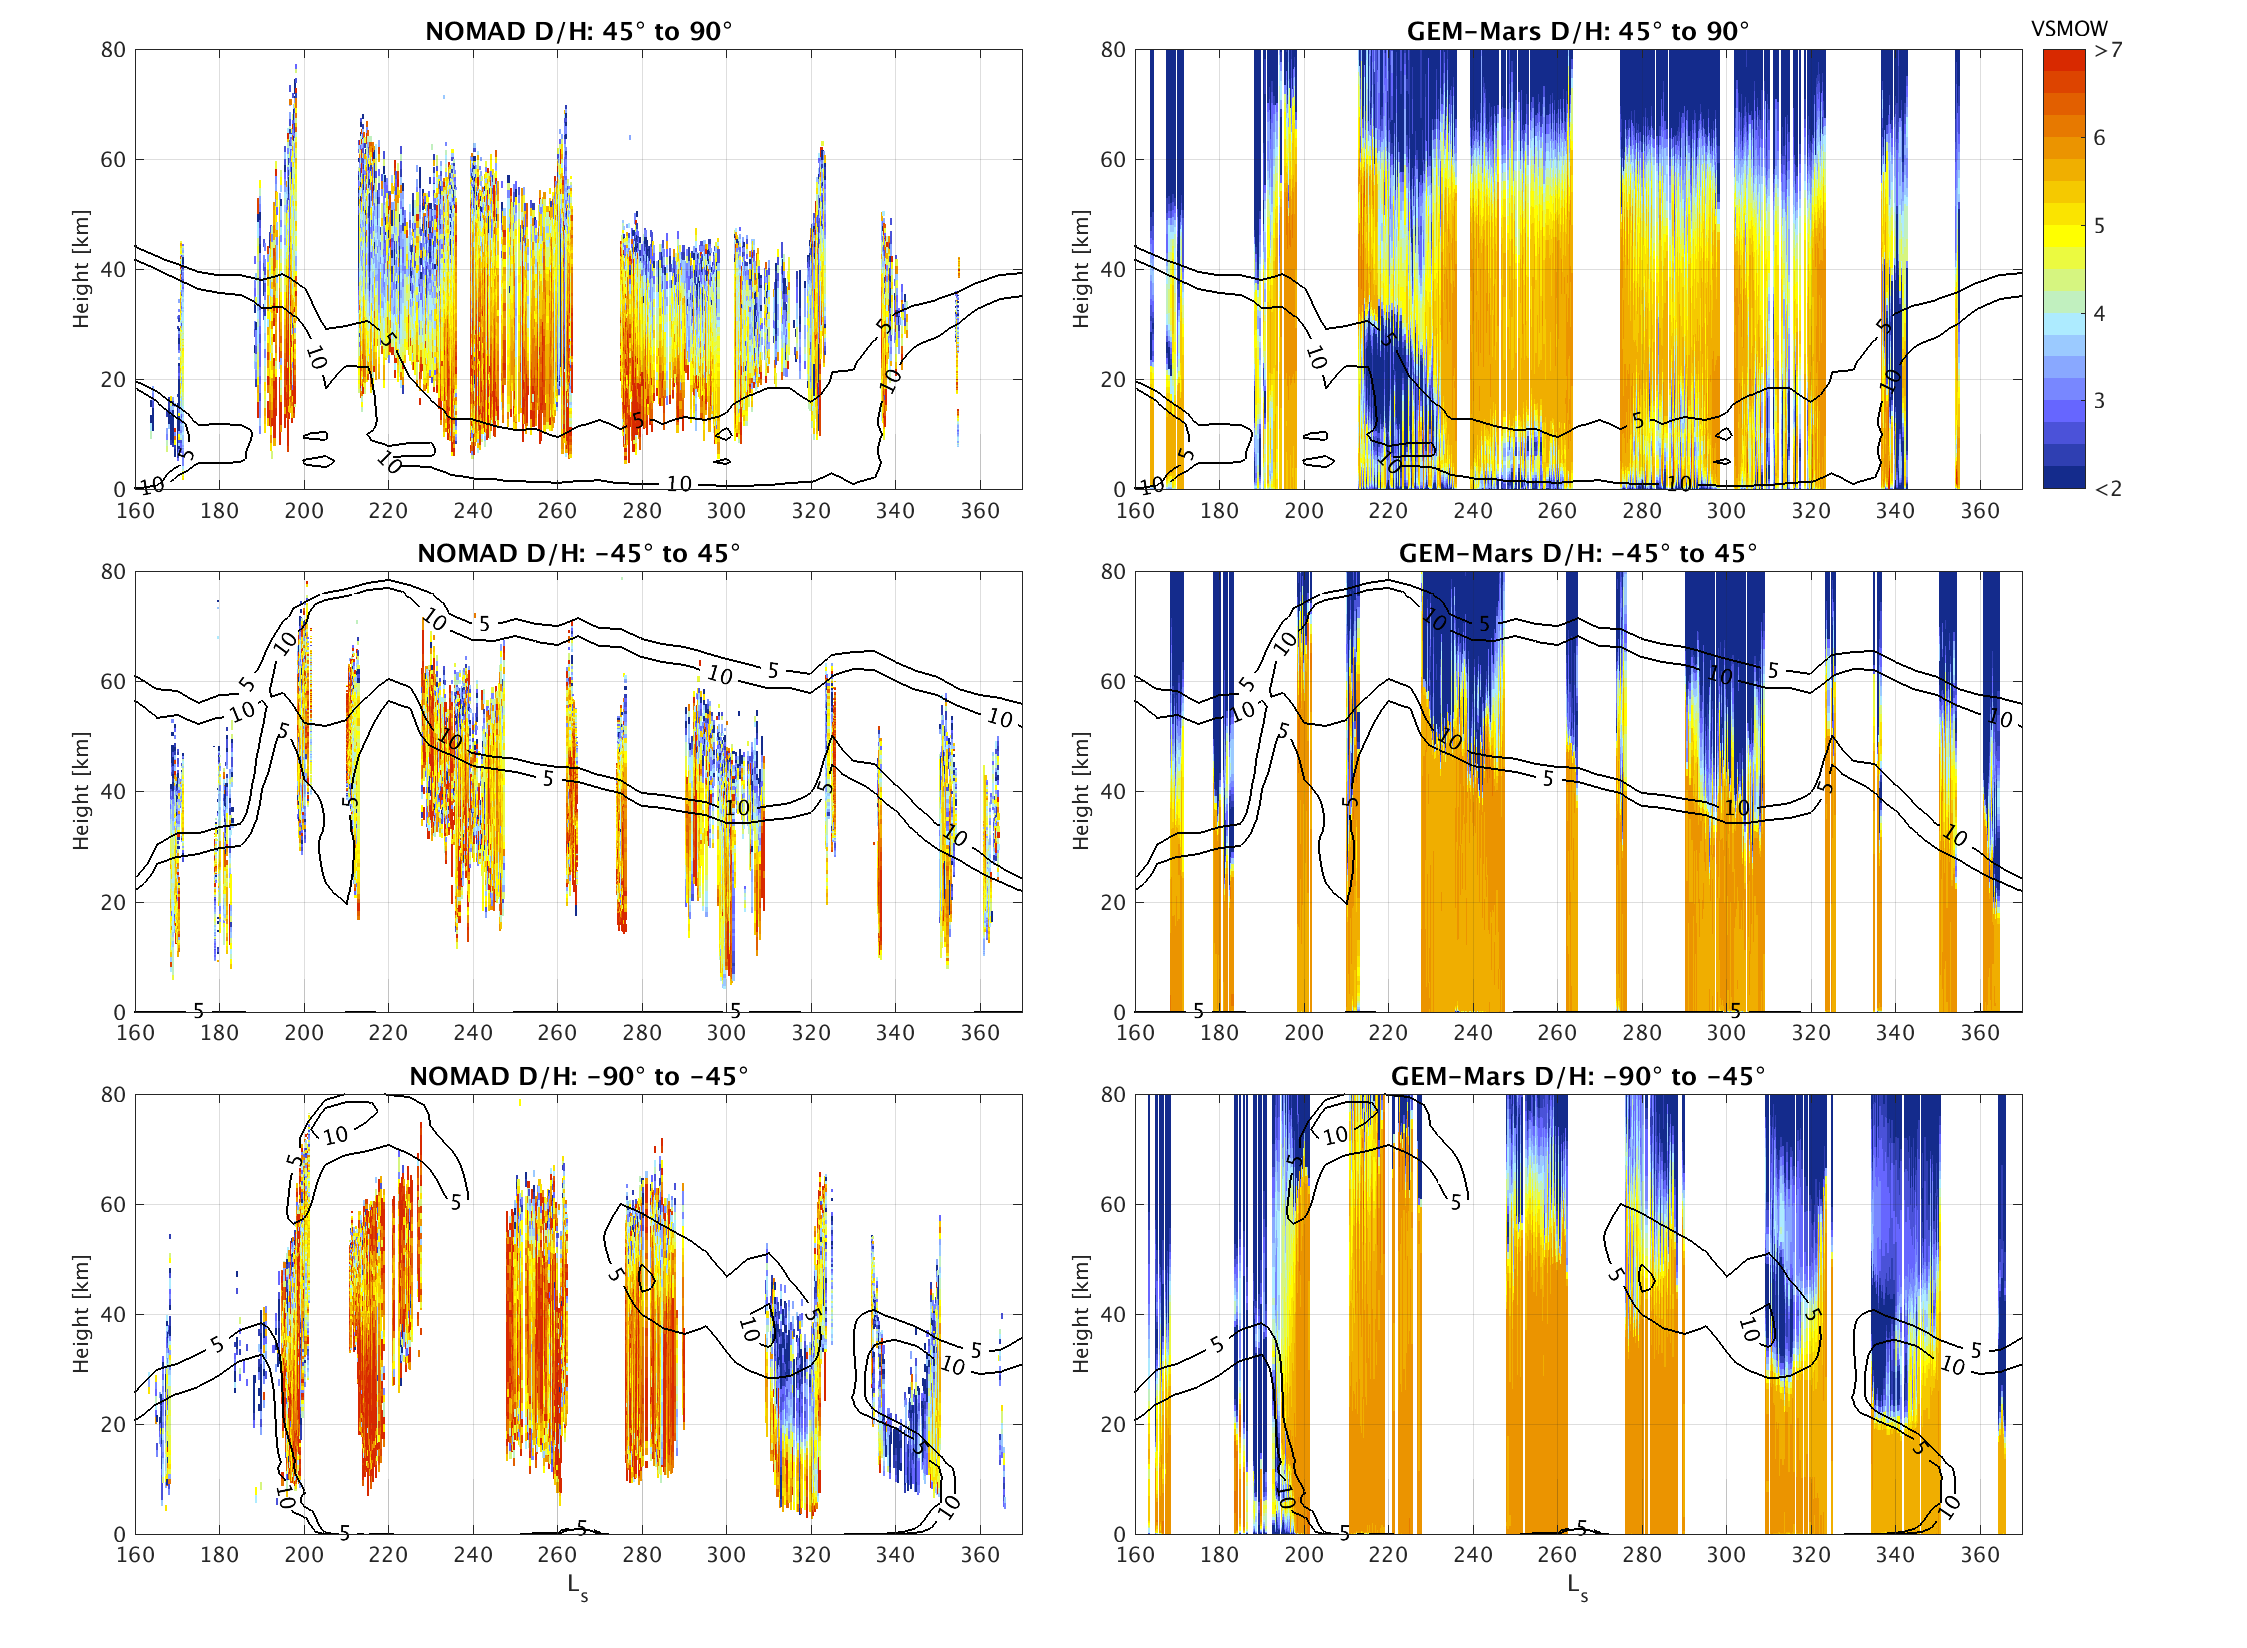
Overview of NOMAD D/H observations (left) and model simulations (right, MY34 simulation) in three wide latitude ranges. The simulation output was interpolated to the time and location of the observations. The black contour lines show the simulated zonal mean ice mass mixing ratio (in ppmm), averaged over the respective latitude ranges, over all local times and over 5° Ls.
PSS (2022) https://doi.org/10.1016/j.pss.2022.105432
Jonathon P. Mason, Manish R. Patel, Mark R. Leese, Brijen G. Hathi, Yannick Willame, Ian R. Thomas, Michael J.Wolff, Cédric Depiesse, James A. Holmes, Graham Sellers, Charlotte Marriner, Bojan Ristic, Frank Daerden, Jose Juan Lopez-Moreno, Giancarlo Bellucci, Ann Carine Vandaele
We present an in-flight straylight removal method for the Ultraviolet and Visible Spectrometer (UVIS) channel of the Nadir and Occultation for Mars Discovery (NOMAD) instrument aboard the ExoMars Trace Gas Orbiter (TGO). The presence of a ‘red-leak’ straylight signal in the UVIS instrument was discovered post-launch in ground calibration measurements of spectral lamps; UVIS observations of lamps with negligible UV light emission (RS12) showed a significant signal at UV wavelengths. Subsequent analyses of nadir observations of the martian atmosphere revealed that at UV wavelengths the red-leak straylight was in excess of 300% of the true UV signal, jeopardising the primary science observations of the instrument (retrievals of atmospheric ozone). By modifying the UVIS readout method to obtain a region of interest around the illuminated region on the Charge-Coupled Device (CCD) detector, instead of a binned one-dimensional spectrum, and utilising straylight profiles derived from measurements of the RS12 calibration lamp we show that the majority of the straylight at UV wavelengths can be successfully removed for the nadir channel in a self-consistent manner. The corrected UVIS radiances are compared to coincident Mars Color Imager (MARCI) instrument observations with residuals between the two instruments generally remaining within 15%.
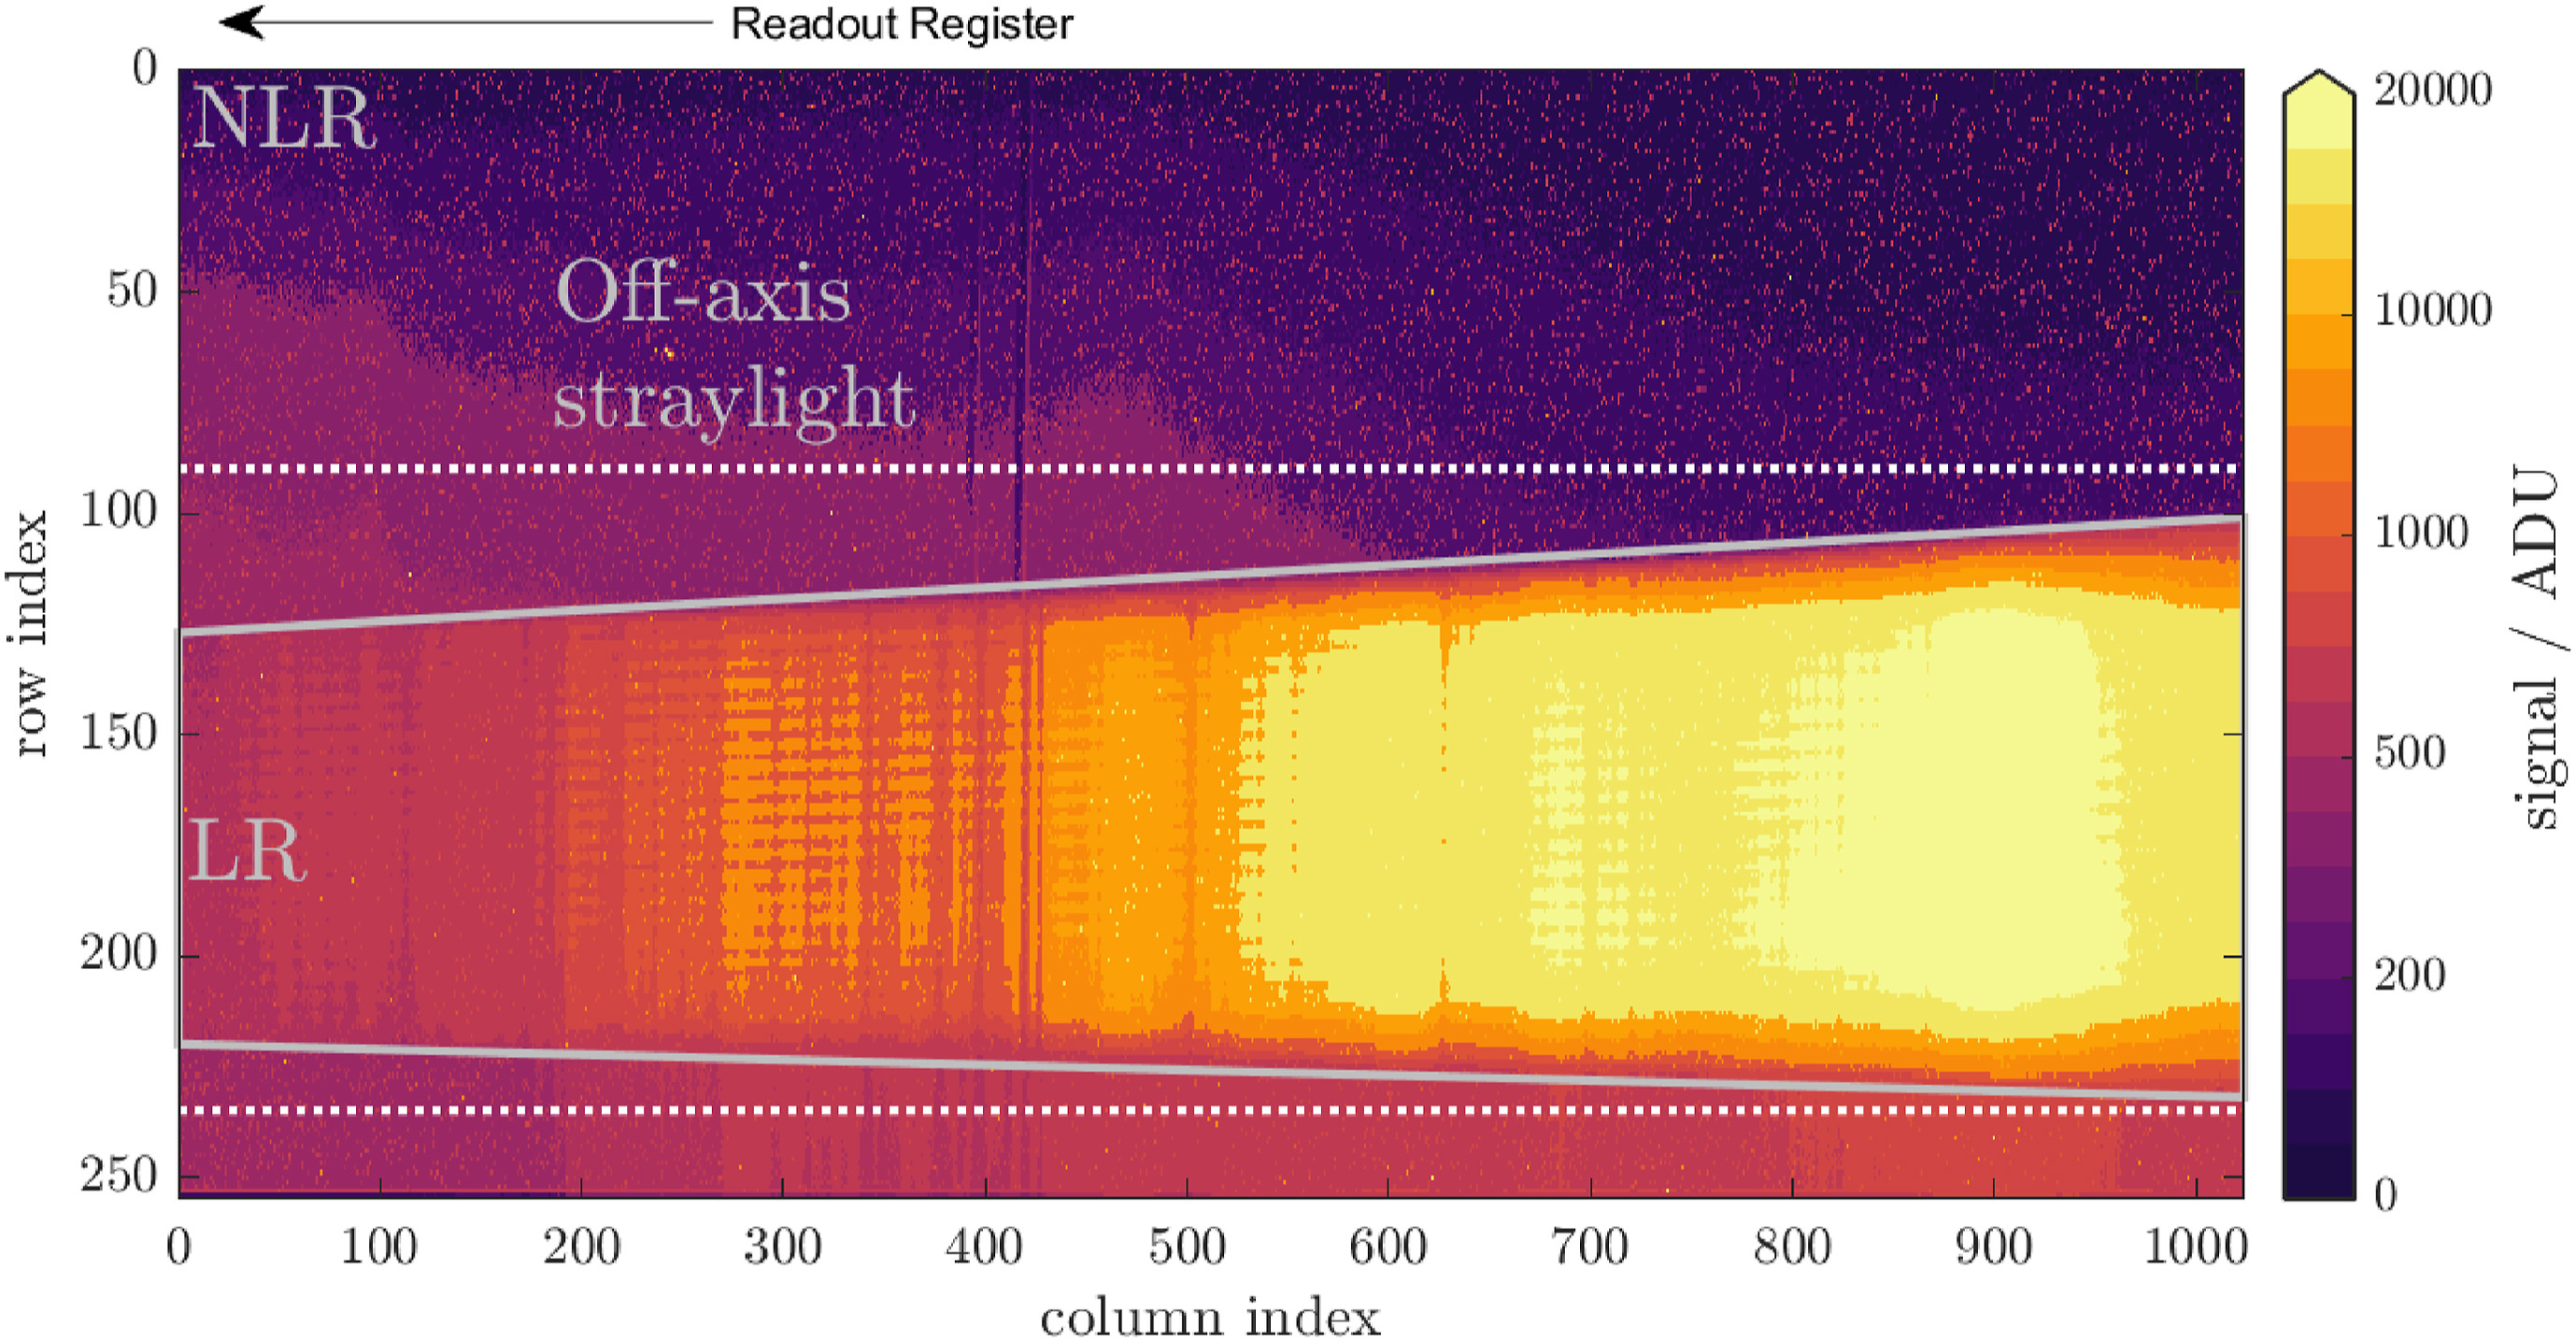
Full frame image of the UVIS detector during a typical nadir measurement. The in-axis light dispersion is defined as the illuminated region (LR) and the off-axis area outside this region is defined as the non-illuminated region (NLR). The off-axis straylight can be seen between the LR and the detector readout register and the white dotted lines show the typical ROI of the CCD that is read out. The visible stratified lines seen in the LR is the illumination from the individual fibres.
PSS (2021) https://doi.org/10.1016/j.pss.2021.105399
G. Cruz Mermy and F. Schmidt and I.R. Thomas and F. Daerden and B. Ristic and M.R. Patel and J.-J. Lopez-Moreno and G. Bellucci and A.C. Vandaele
The LNO channel is one of the 3 instruments of the NOMAD suite of spectrometers onboard the ExoMars Trace Gas Orbiter currently orbiting Mars. Designed to operate primarily at nadir at very high spectral resolution in the 2.3 μm–3.8 μm spectral region, the instrument observes the martian atmosphere and surface daily since March 2018. To perform an accurate calibration of the instrument, in-flight measurement needs to be integrated to account for potential change during the cruise phase and later during the mission. In a companion article, Thomas et al. this issue, PSS, 2021 proposed a method based on the use of 6 observation sequences of the sun by LNO to derive a self-consistent approach, assuming temporal stability. Here we report an alternative concept of calibration, model the instrument using basic principle, based on the comparison between each solar spectrum observed and a reference solar spectrum. The method has the advantages to allows testing of the temporal stability but also instrumental effects such as temperature. It encompasses the main transfer functions of the instrument related to the grating and the AOTF and the instrument line shape using 9 free parameters which, once inverted, allow the observations to be fitted with an acceptable Root Mean Square Error (RMSE) around 0.5%. We propose to perform a continuum removal step to reduce the spurious instrumental effect, allowing to directly analyze the atmospheric lines. This methodology allows quantifying the instrumental sensitivity and its dependence on temperature and time. Once the temperature dependence was estimated and corrected, we found no sign of aging of the detector. Finally, the parameters are used to propose an efficient calibration procedure to convert the LNO-NOMAD data from ADU to radiances with spectral calibration and the instrument line shape. A comparison with the method reported in Thomas et al. this issue, PSS, 2021 showed that both calibrations are in agreement mostly within 3%.
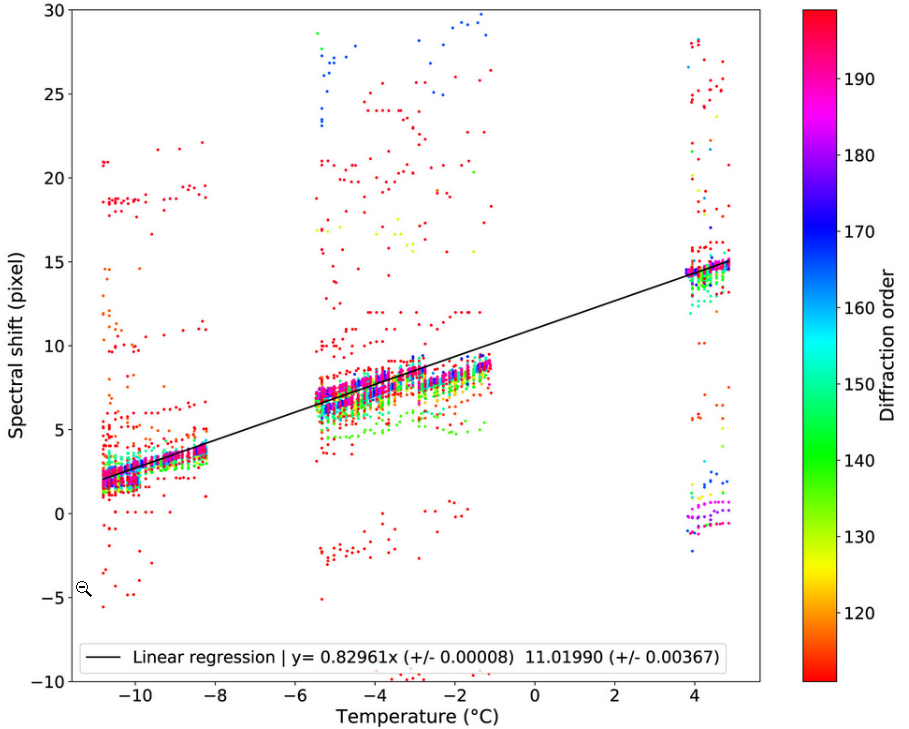
Wavenumber shift δν (in pixel units) retrieved from the calibration inversion. The image shows the shift as a function of temperature. The color refers to the diffraction order.
PSS (2021) https://doi.org/10.1016/j.pss.2021.105410
Ian R. Thomas and Shohei Aoki and Loic Trompet and Séverine Robert and Cédric Depiesse and Yannick Willame and Guillaume Cruz-Mermy and Frédéric Schmidt and Justin T. Erwin and Ann Carine Vandaele and Frank Daerden and Arnaud Mahieux and Eddy Neefs and Bojan Ristic and Laszlo Hetey and Sophie Berkenbosch and Roland Clairquin and Bram Beeckman and Manish R. Patel and Jose Juan Lopez-Moreno and Giancarlo Bellucci.
The Nadir and Occultation for MArs Discovery (NOMAD) instrument is a 3-channel spectrometer suite on the ESA ExoMars Trace Gas Orbiter. Since April 2018, when the nominal science mission began, it has been measuring the constituents of the Martian atmosphere. NOMAD contains three separate spectrometers, two of which operate in the infrared: the Solar Occultation (SO) channel makes only solar occultation observations, and therefore has the best resolving power (∼20,000) and a wider spectral region covering 2.2–4.3 μm. The Limb, Nadir and Occultation (LNO) channel covers the 2.2–3.8 μm spectral region and can operate in limb, nadir or solar occultation pointing modes. The Ultraviolet–VISible (UVIS) channel operates in the UV–visible region, from 200 to 650 nm, and can measure in limb, nadir or solar occultation modes like LNO.
The LNO channel has a lower resolving power (∼10,000) than the SO channel, but is still typically an order of magnitude better than previous instruments orbiting Mars. The channel primarily operates in nadir-viewing mode, pointing directly down to the surface to measure the narrow atmospheric molecular absorption lines, clouds and surface features in the reflected sunlight. From the depth and position of the observed atmospheric absorption lines, the constituents of the Martian atmosphere and their column densities can be derived, leading to new insights into the processes that govern their distribution and transport. Surface properties can also be derived from nadir observations by observing the shape of the spectral continuum.
Many calibration measurements were made prior to launch, on the voyage to Mars, and continue to be made in-flight during the science phase of the mission. This work, part 2, addresses the aspects of the LNO channel calibration that are not covered elsewhere, namely: the LNO ground calibration setup, the LNO occultation and nadir boresight pointing vectors, LNO detector characterisation and nadir/limb illumination pattern, instrument temperature effects, and finally the radiometric calibration of the LNO channel. An accompanying paper, part 1 (Thomas et al., 2021, this issue), addresses similar aspects for SO, the other infrared channel in NOMAD. A further accompanying paper (Cruz-Mermy et al., 2021, this issue) investigated the LNO radiometric calibration in more detail, approaching the work from a theoretical perspective. The two calibrations agree with each other to within 3%, validating each calibration method.
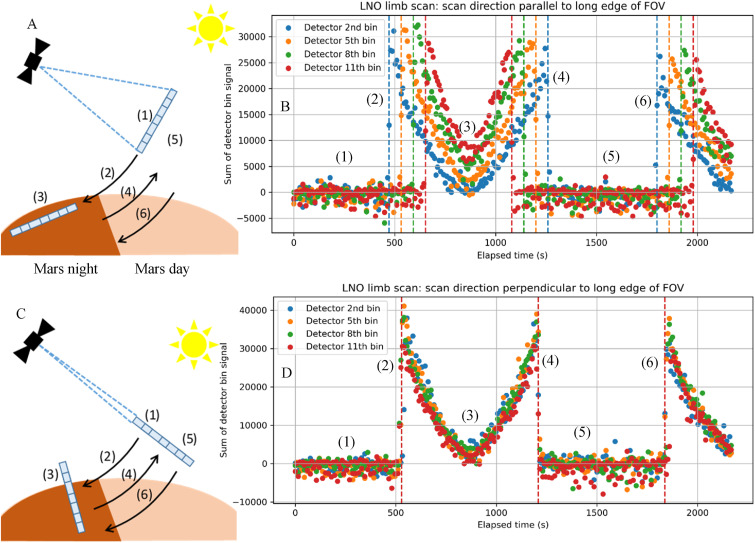
LNO detector signal on four detector bins as the FOV is slewed across the sunlit limb of Mars. A + B: The scan direction is parallel to the long edge of the FOV (i.e. perpendicular to the Mars limb); B + D: The scan direction is perpendicular to the long edge of the FOV (i.e. parallel to the Mars limb). The observation sequence is as follows: (1) the signal on each bin is zero when viewing dark space; (2) the signal peaks as the sunlit limb enters the FOV of the bin; (3) the slew continues to the non-illuminated region of the planet and then reverses direction; (4) the signal peaks again as the FOV views the sunlit limb; (5) zero single when viewing dark space; (6) the signal peaks as the sunlit limb enters the FOV. When slewing parallel to the long edge of the FOV, the bins hit the limb at different times (B); when slewing perpendicular, the bins hit the limb at the same time (D). The sunlit limb-crossing points, shown as vertical dashed lines, are analysed to determine the pointing vector of each bin and thus the entire FOV.
PSS (2021) https://doi.org/10.1016/j.pss.2021.105411
Ian R. Thomas and Shohei Aoki and Loic Trompet and Séverine Robert and Cédric Depiesse and Yannick Willame and Justin T. Erwin and Ann Carine Vandaele and Frank Daerden and Arnaud Mahieux and Eddy Neefs and Bojan Ristic and Laszlo Hetey and Sophie Berkenbosch and Roland Clairquin and Bram Beeckman and Manish R. Patel and Jose Juan Lopez-Moreno and Giancarlo Bellucci.
Nadir and Occultation for MArs Discovery (NOMAD) is a 3-channel spectrometer suite that is currently orbiting Mars onboard ESA's ExoMars Trace Gas Orbiter, measuring the composition of the Martian atmosphere in unprecedented detail. Of the three channels, two operate in the infrared: the Solar Occultation (SO) channel observes gas species in the 2.2–4.3 μm spectral region in solar occultation mode, while the Limb, Nadir and Occultation (LNO) channel observes in the 2.2–3.8 μm spectral region and can operate in limb-, nadir- and solar occultation-pointing modes. The Ultraviolet–VISible (UVIS) channel operates in the UV–visible region, from 200 to 650 nm.
Both infrared channels have a spectral resolution typically an order of magnitude better than previous instruments orbiting Mars, to measure molecular absorption lines and therefore determine the abundances of constituents of the Martian atmosphere and the processes that govern their distribution and transport. To maximise the full potential of the instrument, a wide range of calibration measurements were made prior to launch and continue to be made in-flight. This work, part 1, addresses the aspects of the SO channel calibration that are not covered elsewhere, namely: the SO channel ground calibration setup, boresight pointing vector determination, detector characterisation, detector illumination pattern and saturation levels, and an investigation of the instrument line shape. An accompanying paper, part 2, addresses similar aspects for LNO, the other infrared channel in NOMAD (Thomas et al., 2021, this issue).
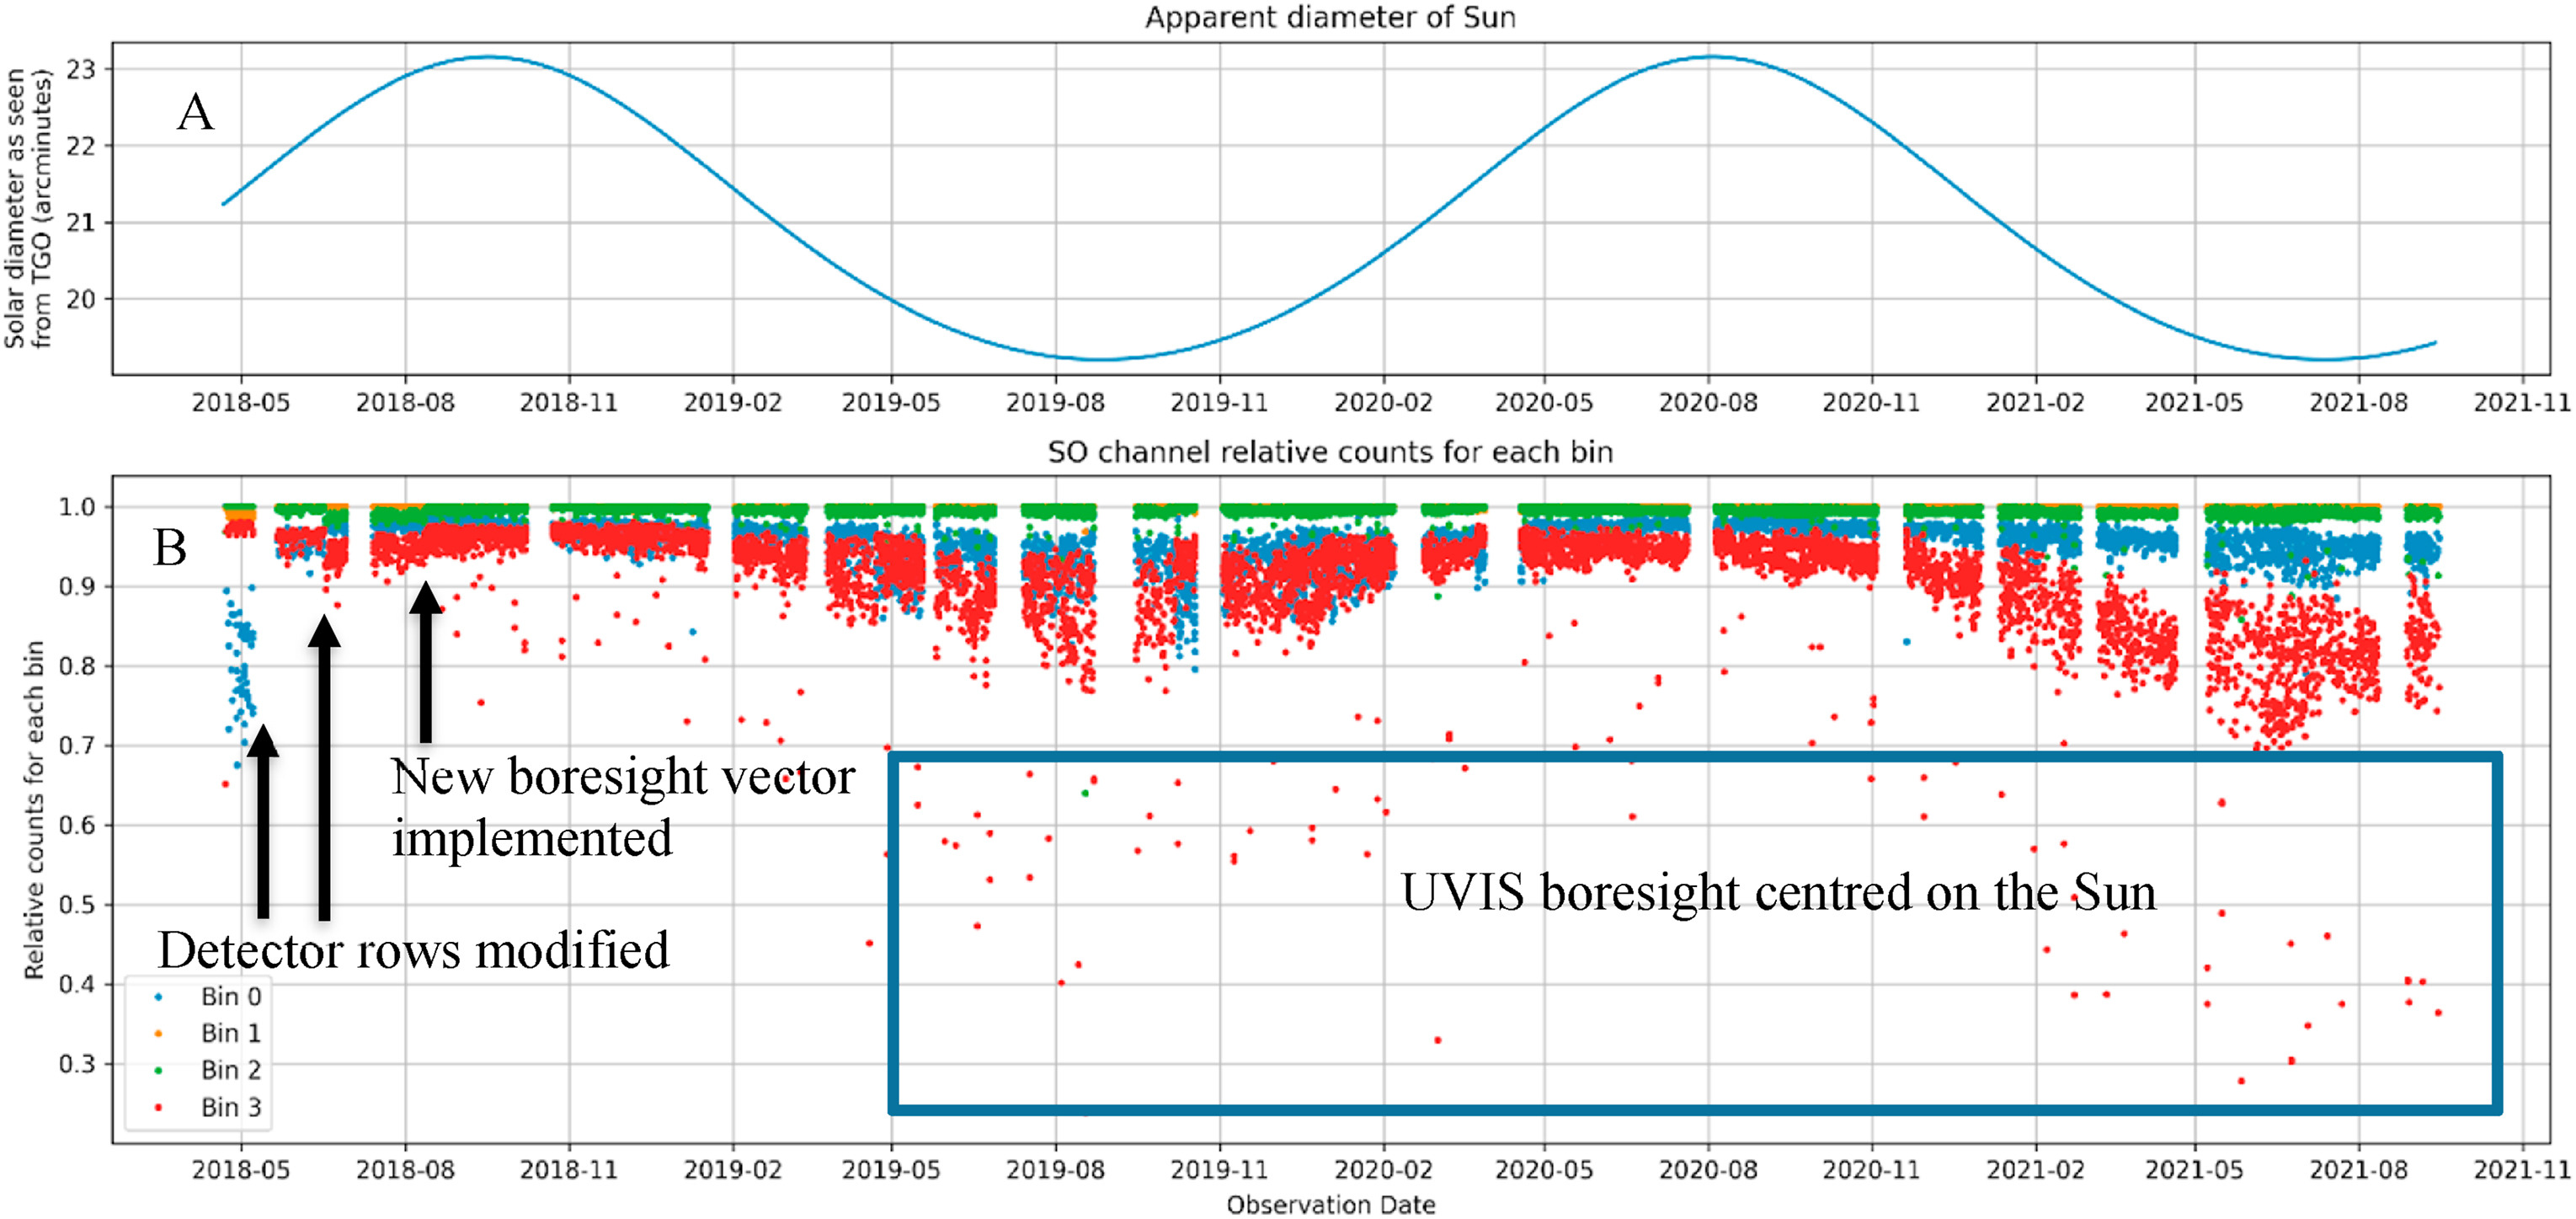
(A) The angular extent of the Sun varies due to the elliptical nature of Mars' orbit, oscillating between 19 and 23 arcminutes. (B) Relative solar signal strength of the four SO channel bins throughout the mission, where the highest signal bin is equal to 1.0. The gaps correspond to occultation-free periods, where the geometry is such that the spacecraft does not occult the planet. Occasionally the UVIS boresight vector is used instead, hence one bin has a lower relative signal. The Sun-Mars distance also affects the relative signal.
GRL (2021) https://doi.org/10.1029/2021GL095895
Giuliano Liuzzi, Geronimo L. Villanueva, Loïc Trompet,Matteo M. J. Crismani,Arianna Piccialli,Shohei Aoki,Miguel Angel Lopez-Valverde,Aurélien Stolzenbach,Frank Daerden,Lori Neary,Michael D. Smith,Manish R. Patel,Stephen R. Lewis,R. Todd Clancy,Ian R. Thomas,Bojan Ristic,Giancarlo Bellucci,Jose-Juan Lopez-Moreno, Ann Carine Vandaele
We present observations of terminator CO2 ice clouds events in three groups: Equatorial dawn, Equatorial dusk (both between 20°S and 20°N) and Southern midlatitudes at dawn (45°S and 55°S east of Hellas Basin) with ESA ExoMars Trace Gas Orbiter's Nadir and Occultation for MArs Discovery instrument. CO2 ice abundance is retrieved simultaneously with water ice, dust, and particle sizes, and rotational temperature and CO2 column profiles in 16 of 26 cases. Small particles (<0.5 μm) prevail at dusk, while water ice likely provides most source nuclei at dawn. Clouds east of Hellas are found to be dominantly nucleated on surface-lifted dust. CO2 ice is sometimes detected in unsaturated air together with dust nuclei at dawn, suggesting ongoing sublimation. Depending on latitude and local time, the interplay between particle precipitation and the lifetime of temperature minima (i.e., cold pockets) determines CO2 ice properties.
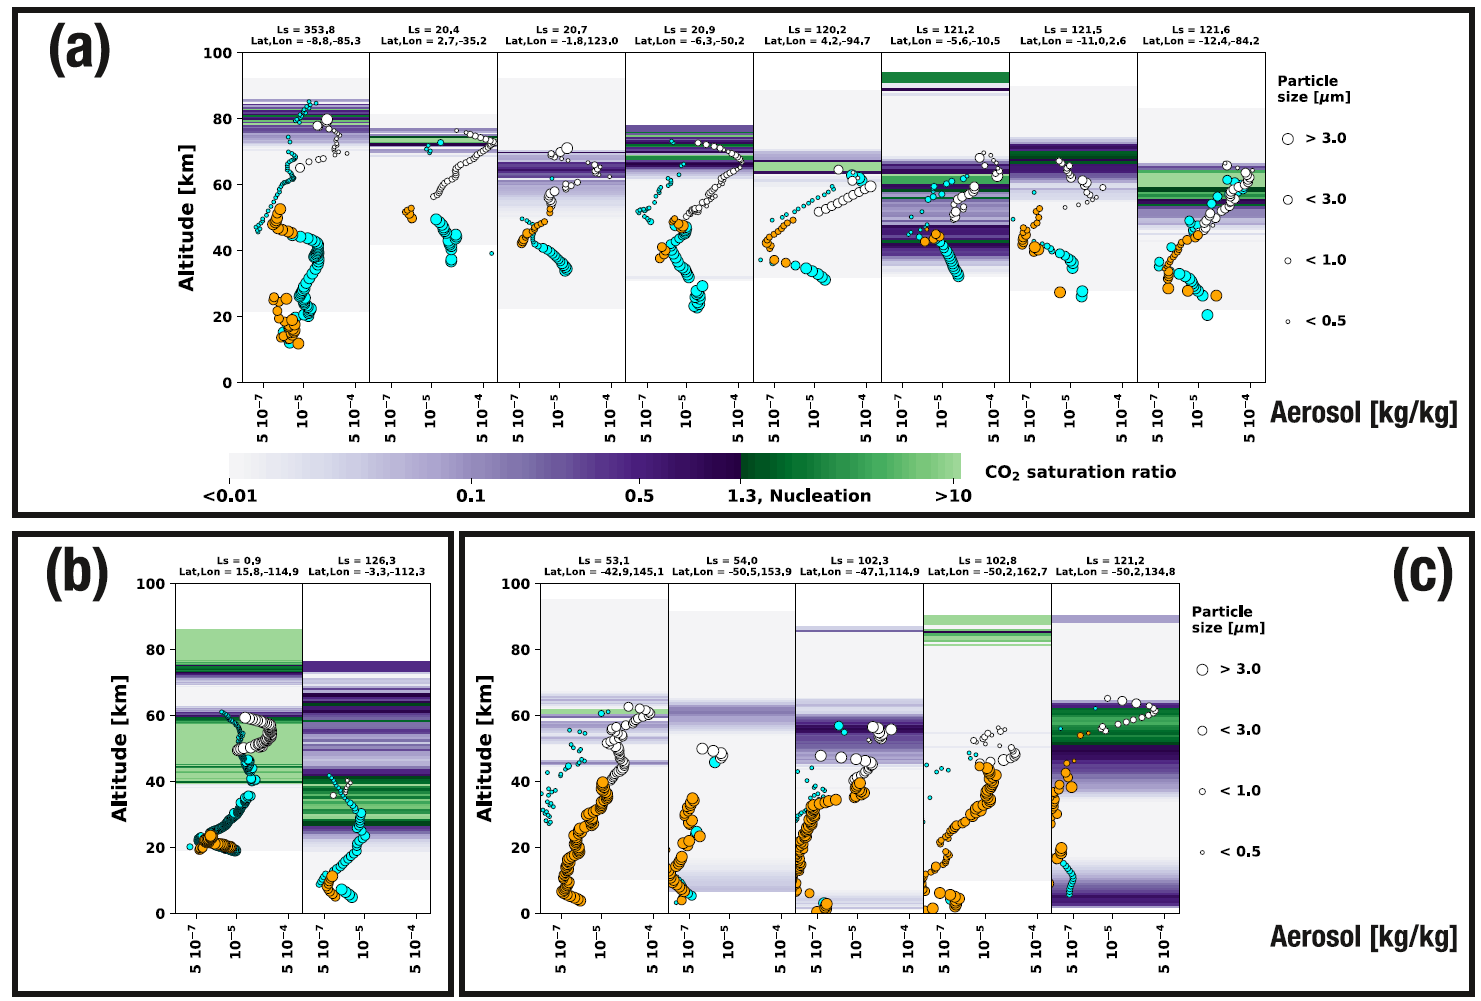
(a) Summary of the detections in the Equatorial region at dusk, dawn (b) and in the Hellas region at dawn (c). The plots report only the cases in which temperature (and CO2 saturation ratio, contours) is retrieved together with the properties of dust (orange dots), CO2 ice (white) and water ice (blue).
https://doi.org/10.1029/2021JE006834
Alain SJ. Khayat, Michael D. Smith, Michael Wolff, Frank Daerden, Lori Neary, Manish R. Patel, Arianna Piccialli, Ann C. Vandaele, Ian Thomas, Bojan Ristic, Jon Mason, Yannick Willame, Cedric Depiesse, Giancarlo Bellucci, José Juan López-Moreno.
Solar occultations performed by the Nadir and Occultation for MArs Discovery (NOMAD) ultraviolet and visible spectrometer (UVIS) onboard the ExoMars Trace Gas Orbiter (TGO) have provided a comprehensive mapping of atmospheric ozone density. The observations here extend over a full Mars year (MY) between April 21, 2018 at the beginning of the TGO science operations during late northern summer on Mars (MY 34, Ls = 163°) and March 9, 2020 (MY 35). UVIS provided transmittance spectra of the Martian atmosphere allowing measurements of the vertical distribution of ozone density using its Hartley absorption band (200 – 300 nm). The overall comparison to water vapor is found in the companion paper to this work (Patel et al., 2021). Our findings indicate the presence of (1) a high-altitude peak of ozone between 40 and 60 km in altitude over the north polar latitudes for at least 45 % of the Martian year during mid-northern spring, late northern summer-early southern spring, and late southern summer, and (2) a second, but more prominent, high-altitude ozone peak in the south polar latitudes, lasting for at least 60 % of the year including the southern autumn and winter seasons. When present, both high-altitude peaks are observed in the sunrise and sunset occultations, suggesting that the layers could persist during the day. Results from the Mars general circulation models predict the general behavior of these peaks of ozone and are used in an attempt to further our understanding of the chemical processes controlling high-altitude ozone on Mars.
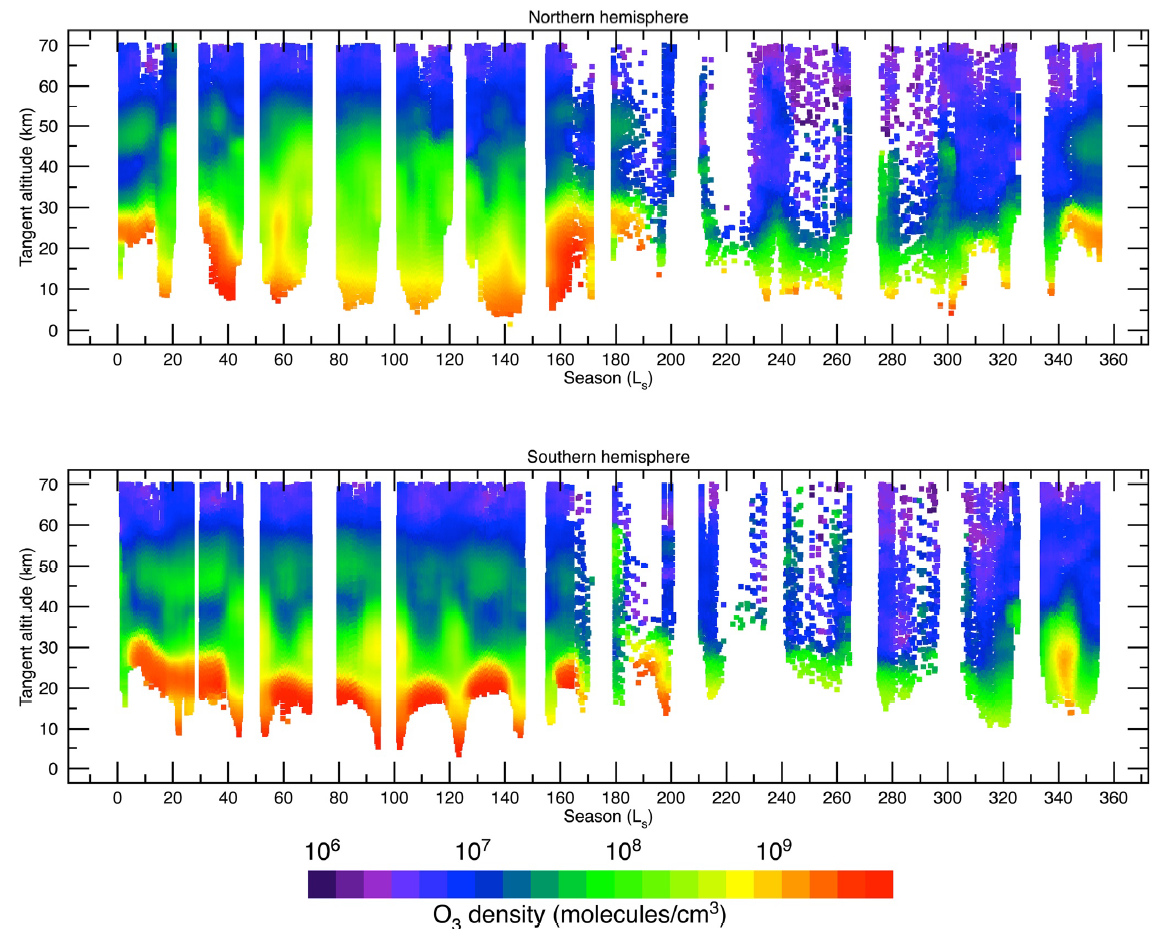
Seasonal distribution of the retrieved vertical O3 abundance (molecules/cm3) in the northern (upper panel) and southern (lower panel) hemispheres. The results are shown after applying a two-dimensional convolution of ∆Ls= 5 ° in the local time dimension (x axis) and ∆? = 3 km in the altitude dimension (y axis). The high-altitude peaks of ozone are visible in both hemispheres during northern spring (southern fall).
JGR (2021) https://doi.org/10.1029/2021JE006837
M. R. Patel, G. Sellers, J. P. Mason, J. A. Holmes, M. A. J. Brown, S. R. Lewis, K. Rajendran, P. M. Streeter, C. Marriner, B. G. Hathi, D. J. Slade, M. R. Leese, M. J. Wolff, A. S. J. Khayat, M. D. Smith, S. Aoki, A. Piccialli, A. C. Vandaele, S. Robert, F. Daerden, I. R. Thomas, B. Ristic, Y. Willame, C. Depiesse, G. Bellucci, J.-J. Lopez-Moreno
We present ∼1.5 Mars Years (MY) of ozone vertical profiles, covering LS = 163° in MY34 to LS = 320° in MY35, a period which includes the 2018 global dust storm. Since April 2018, the Ultraviolet and Visible Spectrometer channel of the Nadir and Occultation for Mars Discovery (NOMAD) instrument aboard the ExoMars Trace Gas Orbiter has observed the vertical, latitudinal and seasonal distributions of ozone. Around perihelion, the relative abundance of both ozone and water (from coincident NOMAD measurements) increases with decreasing altitude below ∼40 km. Around aphelion, localized decreases in ozone abundance exist between 25 and 35 km coincident with the location of modeled peak water abundances. High-latitude (>±55°), high altitude (40–55 km) equinoctial ozone enhancements are observed in both hemispheres (LS ∼350°–40°) and discussed in the companion article to this work (Khayat et al., 2021). The descending branch of the main Hadley cell shapes the observed ozone distribution at LS = 40°–60°, with the possible signature of a northern hemisphere thermally indirect cell identifiable from LS = 40°–80°. Morning terminator observations show elevated ozone abundances with respect to evening observations, with average ozone abundances between 20 and 40 km an order of magnitude higher at sunrise compared to sunset, attributed to diurnal photochemical partitioning along the line of sight between ozone and O or fluctuations in water abundance. The ozone retrievals presented here provide the most complete global description of Mars ozone vertical distributions to date as a function of season and latitude.
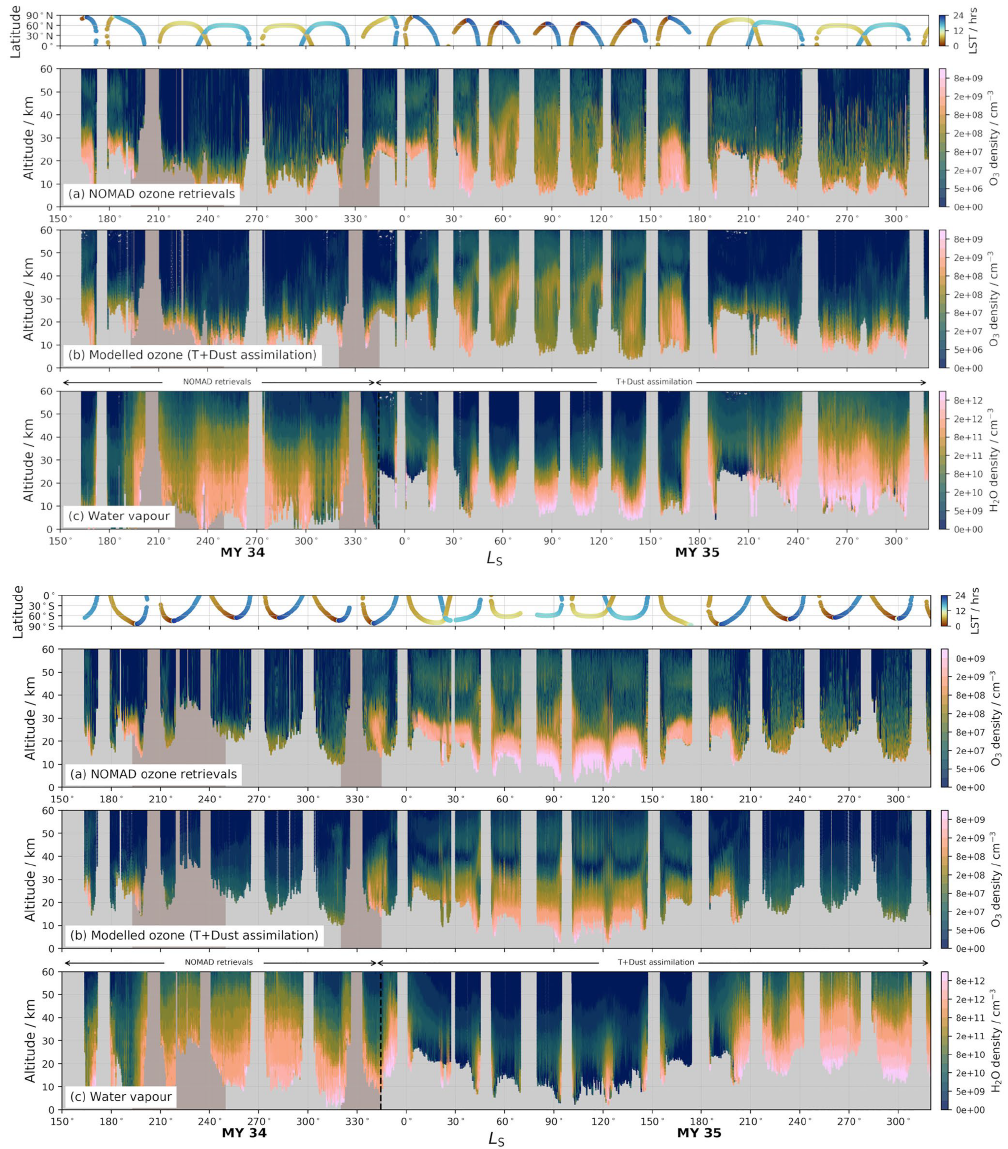
JGR (2021) https://doi.org/10.1029/2021JE006878 http://oro.open.ac.uk/79769/2/Crismani%202021accepted.pdf
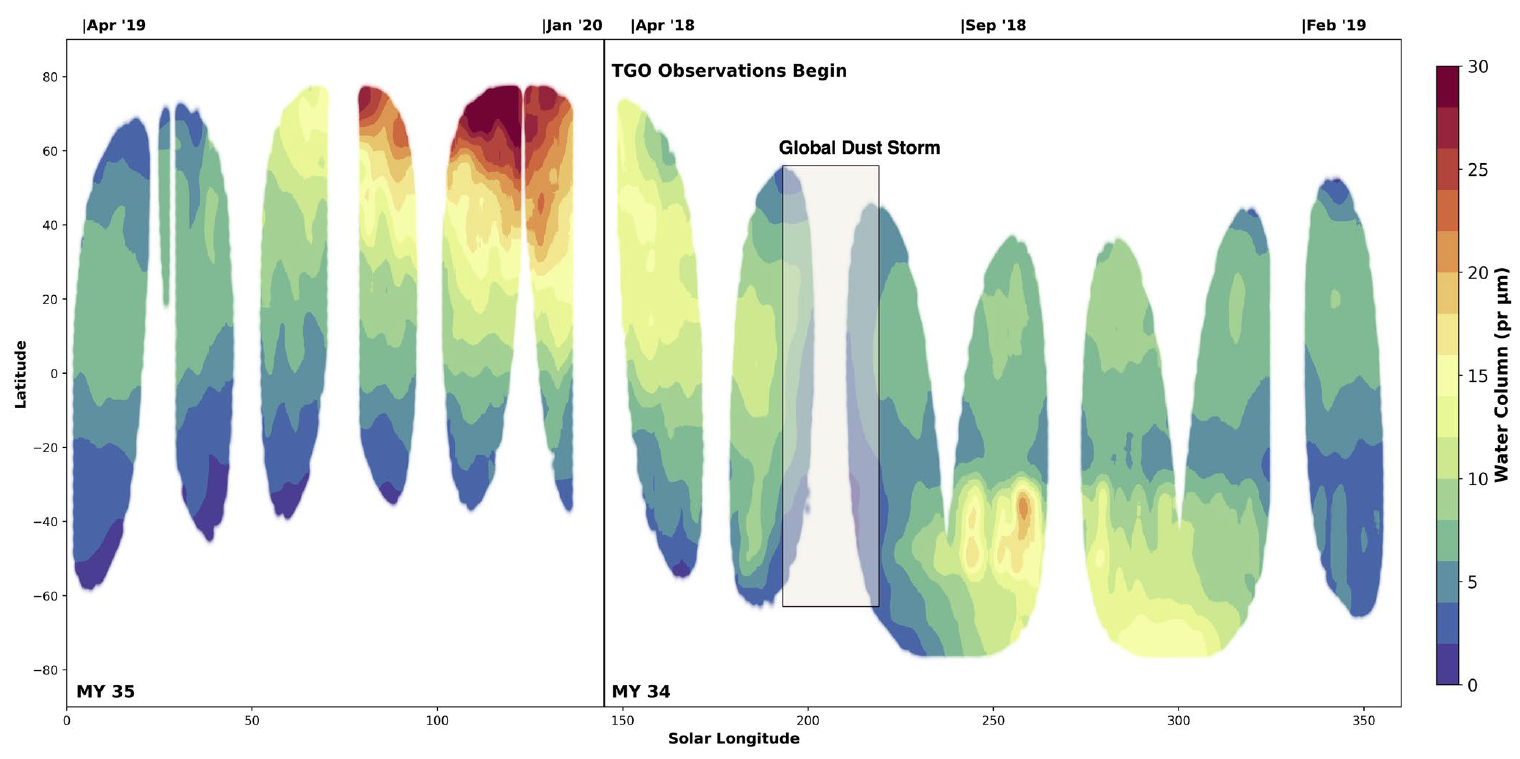
Nature Astronomy (2021) https://doi.org/10.1038/s41550-021-01425-w
M. S. Chaffin, D. M. Kass, S. Aoki, A. A. Fedorova, J. Deighan, K. Connour, N. G. Heavens, A. Kleinböhl, S. K. Jain, J.-Y. Chaufray, M. Mayyasi, J. T. Clarke, A. I. F. Stewart, J. S. Evans, M. H. Stevens, W. E. McClintock, M. M. J. Crismani, G. M. Holsclaw, F. Lefevre, D. Y. Lo, F. Montmessin, N. M. Schneider, B. Jakosky, G. Villanueva, G. Liuzzi, F. Daerden, I. R. Thomas, J.-J. Lopez-Moreno, M. R. Patel, G. Bellucci, B. Ristic, J. T. Erwin, A. C. Vandaele, A. Trokhimovskiy, O. I. Korablev
Mars has lost most of its initial water to space as atomic hydrogen and oxygen. Spacecraft measurements have determined that present-day hydrogen escape undergoes large variations with season that are inconsistent with long-standing explanations. The cause is incompletely understood, with likely contributions from seasonal changes in atmospheric circulation, dust activity and solar extreme ultraviolet input. Although some modelling and indirect observational evidence suggest that dust activity can explain the seasonal trend, no previous study has been able to unambiguously distinguish seasonal from dust-driven forcing. Here we present synoptic measurements of dust, temperature, ice, water and hydrogen on Mars during a regional dust event, demonstrating that individual dust events can boost planetary H loss by a factor of five to ten. This regional storm occurred in the declining phase of the known seasonal trend, establishing that dust forcing can override this trend to drive enhanced escape. Because similar regional storms occur in most Mars years, these storms may be responsible for a large fraction of Martian water loss and represent an important driver of Mars atmospheric evolution.
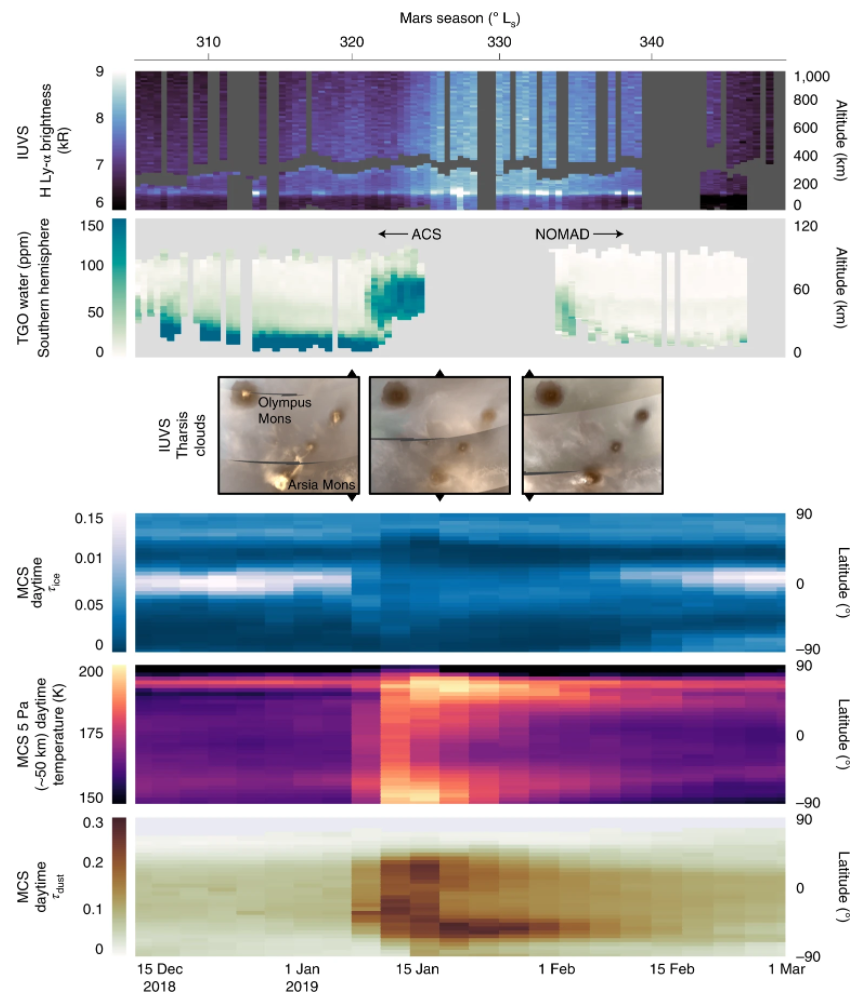
From bottom to top: dust optical depth (τdust) observed by the MCS induces a large change in mid-atmosphere temperatures and intensifies interhemispheric circulation, inhibiting ice condensation and lowering ice optical depth (τice). IUVS observes equatorial clouds capping the Tharsis volcanoes before and after but not during the event. TGO observes the water that would have condensed into clouds at higher altitudes during the event, peaking ~1 week after the beginning of the event. IUVS observes hydrogen increase in brightness by ~50% as a result of this event, consistent with an increase in H loss by a factor of several. Because this event occurred well after southern summer solstice and perihelion, we can conclude that the increase in H loss is controlled by dust dynamics rather than by seasonal changes.
If you have interesting results that you would like to reach a wider audience, ESA can publicise your work!
Submission Procedure
- This should be done around the time of first journal submission, and at least a month before the expected publishing date.
- Download the web release form (.docx)
- ESA will contact you, and assign a writer to develop your story, make infographics, etc.
https://doi.org/10.1029/2021GL092506 https://orfeo.kbr.be/bitstream/handle/internal/7865/Aoki%282021a%29.pdf
S. Aoki, F. Daerden, S. Viscardy, I. R. Thomas, J. T. Erwin, S. Robert, L. Trompet, L. Neary, G. L. Villanueva, G. Liuzzi, M. M. J. Crismani, R. T. Clancy, J. Whiteway, F. Schmidt, M. A. Lopez-Valverde, B. Ristic, M. R. Patel, G. Bellucci, J.-J. Lopez-Moreno, K. S. Olsen, F. Lefèvre, F. Montmessin, A. Trokhimovskiy, A. A. Fedorova, O. Korablev, A. C. Vandaele
Hydrogen chloride (HCl) was recently discovered in the atmosphere of Mars by two spectrometers onboard the ExoMars Trace Gas Orbiter. The reported detection made in Martian Year 34 was transient, present several months after the global dust storm during the southern summer season. Here, we present the full data set of vertically resolved HCl detections obtained by the NOMAD instrument, which covers also Martian year 35. We show that the particular increase of HCl abundances in the southern summer season is annually repeated, and that the formation of HCl is independent from a global dust storm event. We also find that the vertical distribution of HCl is strikingly similar to that of water vapor, which suggests that the uptake by water ice clouds plays an important role. The observed rapid decrease of HCl abundances at the end of the southern summer would require a strong sink independent of photochemical loss.
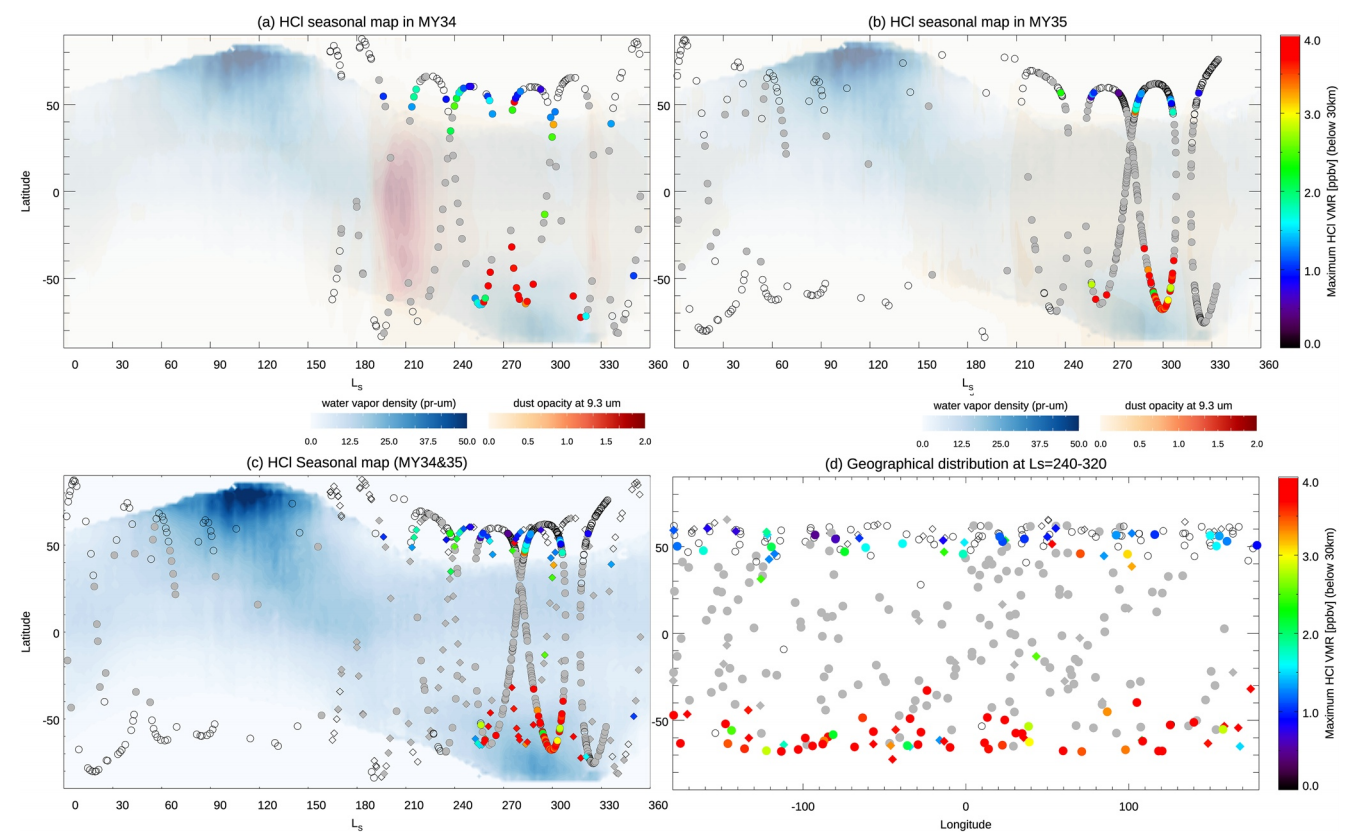
(a–c) Solar longitude—Latitude map of the maximum HCl mixing ratio (ppbv) below 30 km in (a) MY 34, (b) MY 35, and (c) MY34-35 plotted together. Only 3-σ detections are shown here. The gray points show observations corresponding to dust top altitude greater than 25 km, for which it is generally difficult to perform robust retrievals. The background color maps show the column-integrated water vapor density (pr-µm) obtained by MGS/TES for Mars year 26 (Smith, 2002, 2006) and the column-integrated dust opacity at 9.3 µm normalized for 610 Pa for MY 31 (b) and MY 34 (a) (Montabone et al., 2020). (d) Geographical distribution of HCl below 30 km in the seasonal range between Ls = 240° and 320°.
http://doi.org/10.1029/2020GL092334 https://orbi.uliege.be/bitstream/2268/260221/1/GRL-Martian%20red%20dayglow.pdf
J.‐C. Gérard, S. Aoki, L. Gkouvelis, L. Soret, Y. Willame, I. R. Thomas, C. Depiesse, B. Ristic, A. C. Vandaele, B. Hubert, F. Daerden, M. R. Patel, J.‐J. López‐Moreno, G. Bellucci, J. P. Mason, M. A. López‐Valverde
Following the recent detection of the oxygen green line airglow on Mars, we have improved the statistical analysis of the data recorded by the NOMAD/UVIS instrument on board the ExoMars Trace Gas Orbiter mission by summing up hundreds of spectra to increase the signal‐to‐noise ratio. This led to the observation of the OI 630 nm emission, the first detection in a planetary atmosphere outside the Earth. The average limb profile shows a broad peak intensity of 4.8 kR near 150 km. Comparison with a photochemical model indicates that it is well predicted by current photochemistry, considering the sources of uncertainty. The red/green line intensity ratio decreases dramatically with altitude as a consequence of the efficient quenching of O(1D) by CO2. Simultaneous observations of the green and red dayglow will provide information on variations in the thermosphere in response to seasonal changes and the effects of solar events.
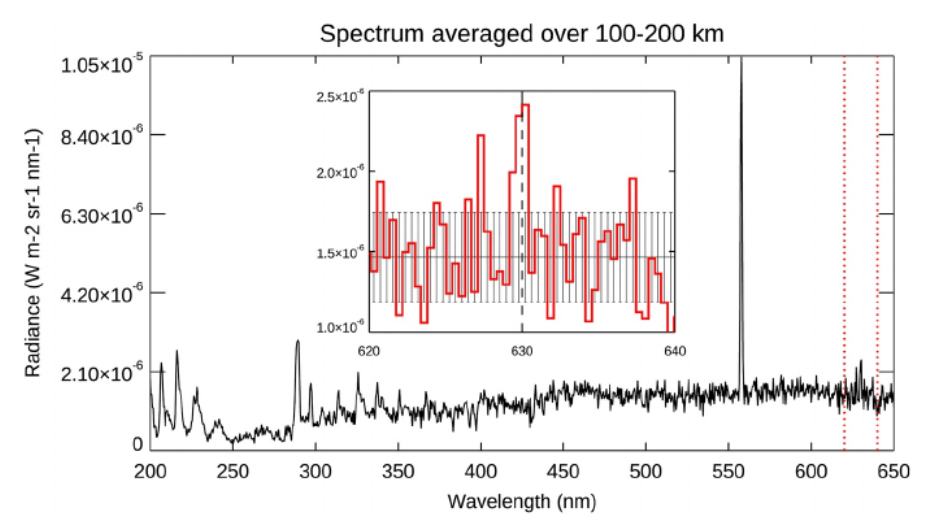
UVIS mean limb spectra averaged between 100 and 200 km of tangent point altitude. The insert is a zoom between 620 and 640 nm showing the detection of the 630 nm forbidden oxygen line (dotted line) reaching 2.3 times the background one-sigma level.
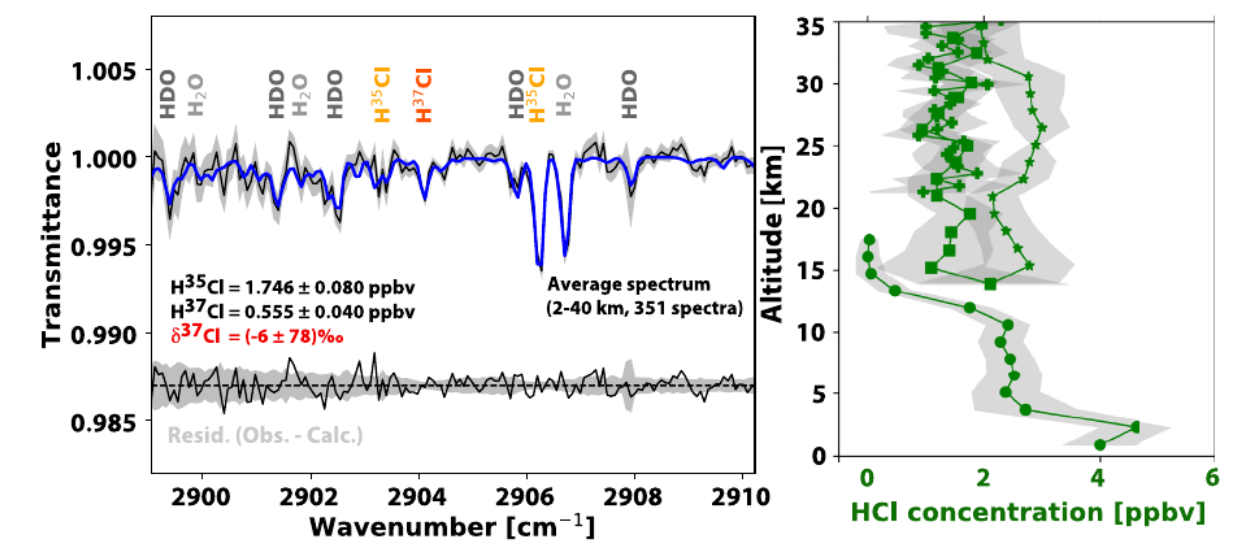
https://doi.org/10.1016/j.icarus.2021.114404; https://orfeo.belnet.be/handle/internal/7742
Michael D. Smith, Frank Daerden, Lori Neary, Alain S.J. Khayat, James A. Holmes, Manish R. Patel, Geronimo Villanueva, Giuliano Liuzzi, Ian R. Thomas, Bojan Ristic, Giancarlo Bellucci, Jose Juan Lopez-Moreno, Ann Carine Vandaele.
More than a full Martian year of observations have now been made by the Nadir Occultation for MArs Discovery (NOMAD) instrument suite on-board the ExoMars Trace Gas Orbiter. Radiative transfer modeling of NOMAD observations taken in the nadir geometry enable the seasonal and global-scale variations of carbon monoxide gas in the Martian atmosphere to be characterized. These retrievals show the column-averaged volume mixing ratio of carbon monoxide to be about 800 ppmv, with significant variations at high latitudes caused by the condensation and sublimation of the background CO2 gas. Near summer solstice in each hemisphere, the CO volume mixing ratio falls to 400 ppmv in the south and 600 ppmv in the north. At low latitudes, carbon monoxide volume mixing ratio inversely follows the annual cycle of surface pressure. Comparison of our retrieved CO volume mixing ratio against that computed by the GEM-Mars general circulation model reveals a good match in their respective seasonal and spatial trends, and can provide insight into the physical processes that control the distribution of CO gas in the current Martian atmosphere.
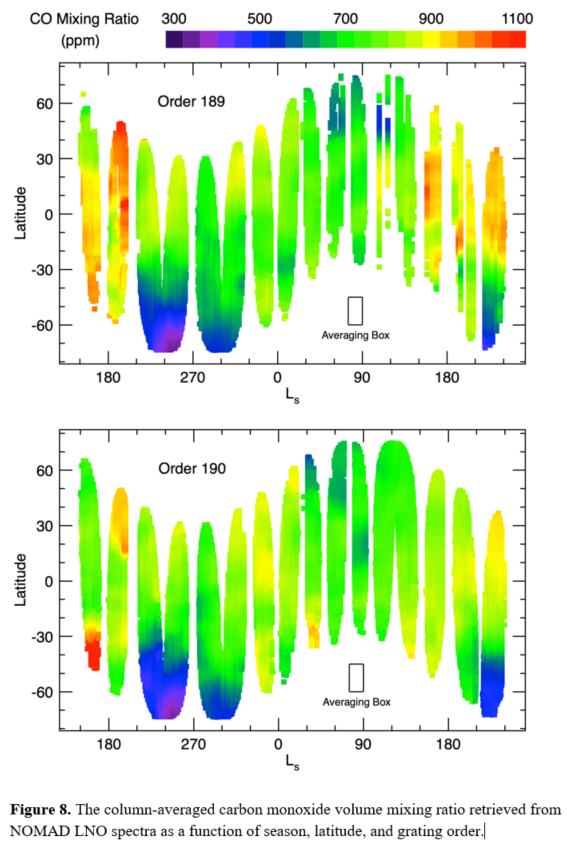
Space Science Reviews, 08 February 2021, https://doi.org/10.1007/s11214-020-00788-2
C. E. Newman, M. de la Torre Juárez, J. Pla-García, R. J. Wilson, S. R. Lewis, L. Neary, M. A. Kahre, F. Forget, A. Spiga, M. I. Richardson, F. Daerden, T. Bertrand, D. Viúdez-Moreiras, R. Sullivan, A. Sánchez-Lavega, B. Chide & J. A. Rodriguez-Manfredi
Nine simulations are used to predict the meteorology and aeolian activity of the Mars 2020 landing site region. Predicted seasonal variations of pressure and surface and atmospheric temperature generally agree. Minimum and maximum pressure is predicted at Ls∼145∘ and 250∘, respectively. Maximum and minimum surface and atmospheric temperature are predicted at Ls∼180∘ and 270∘, respectively; i.e., are warmest at northern fall equinox not summer solstice. Daily pressure cycles vary more between simulations, possibly due to differences in atmospheric dust distributions. Jezero crater sits inside and close to the NW rim of the huge Isidis basin, whose daytime upslope (∼east-southeasterly) and nighttime downslope (∼northwesterly) winds are predicted to dominate except around summer solstice, when the global circulation produces more southerly wind directions. Wind predictions vary hugely, with annual maximum speeds varying from 11 to 19 ms−1 and daily mean wind speeds peaking in the first half of summer for most simulations but in the second half of the year for two. Most simulations predict net annual sand transport toward the WNW, which is generally consistent with aeolian observations, and peak sand fluxes in the first half of summer, with the weakest fluxes around winter solstice due to opposition between the global circulation and daytime upslope winds. However, one simulation predicts transport toward the NW, while another predicts fluxes peaking later and transport toward the WSW. Vortex activity is predicted to peak in summer and dip around winter solstice, and to be greater than at InSight and much greater than in Gale crater.
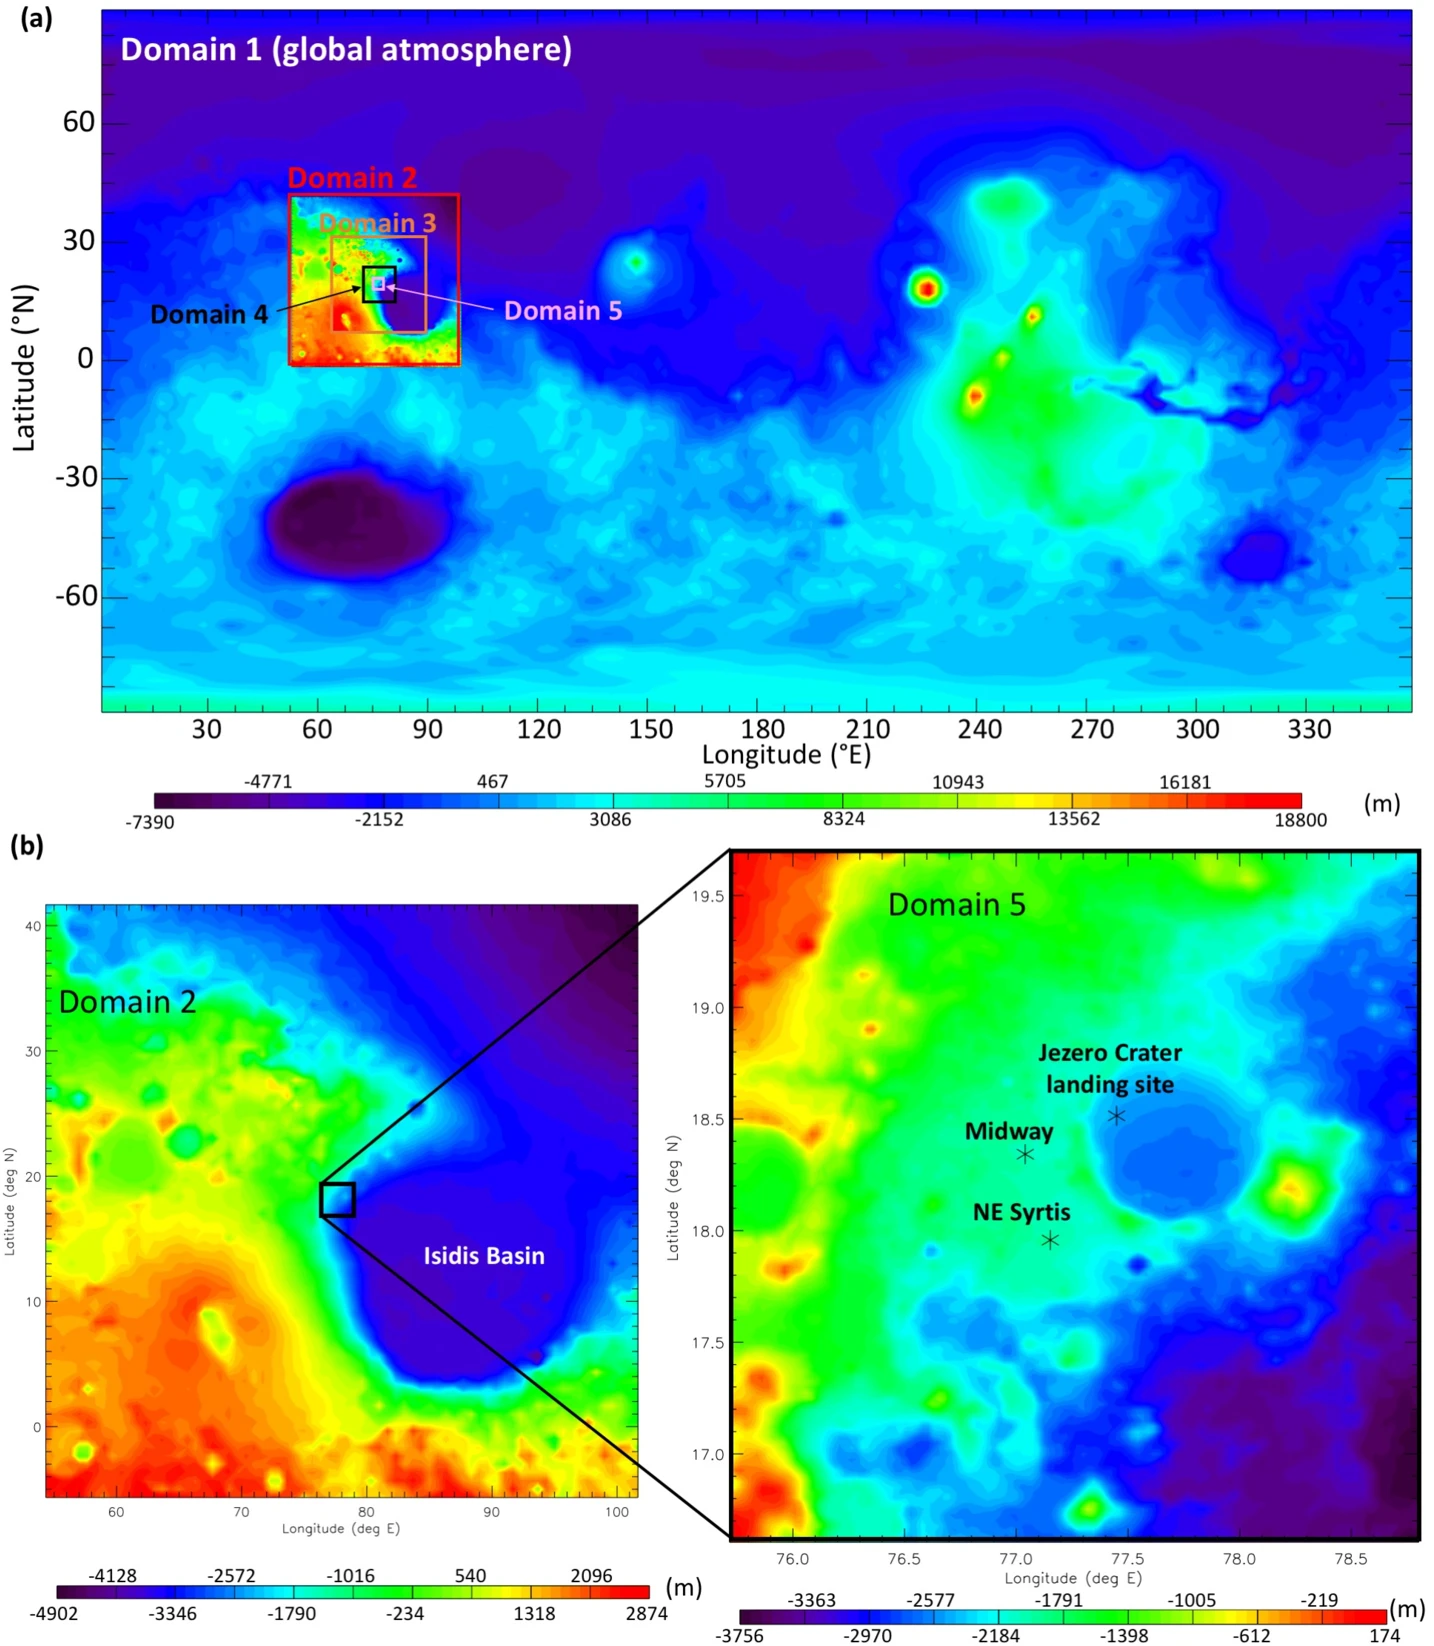
Science Advances 10 Feb 2021, https://doi.org/10.1126/sciadv.abc8843
View ORCID ProfileGeronimo L. Villanueva, View ORCID ProfileGiuliano Liuzzi, View ORCID ProfileMatteo M. J. Crismani, View ORCID ProfileShohei Aoki, View ORCID ProfileAnn Carine Vandaele, View ORCID ProfileFrank Daerden, View ORCID ProfileMichael D. Smith, Michael J. Mumma, View ORCID ProfileElise W. Knutsen, View ORCID ProfileLori Neary, View ORCID ProfileSebastien Viscardy, View ORCID ProfileIan R. Thomas, View ORCID ProfileMiguel Angel Lopez-Valverde, View ORCID ProfileBojan Ristic, View ORCID ProfileManish R. Patel, View ORCID ProfileJames A. Holmes, View ORCID ProfileGiancarlo Bellucci, View ORCID ProfileJose Juan Lopez-Moreno, and the NOMAD team
Isotopic ratios and, in particular, the water D/H ratio are powerful tracers of the evolution and transport of water on Mars. From measurements performed with ExoMars/NOMAD, we observe marked and rapid variability of the D/H along altitude on Mars and across the whole planet. The observations (from April 2018 to April 2019) sample a broad range of events on Mars, including a global dust storm, the evolution of water released from the southern polar cap during southern summer, the equinox phases, and a short but intense regional dust storm. In three instances, we observe water at very high altitudes (>80 km), the prime region where water is photodissociated and starts its escape to space. Rayleigh distillation appears the be the driving force affecting the D/H in many cases, yet in some instances, the exchange of water reservoirs with distinctive D/H could be responsible.
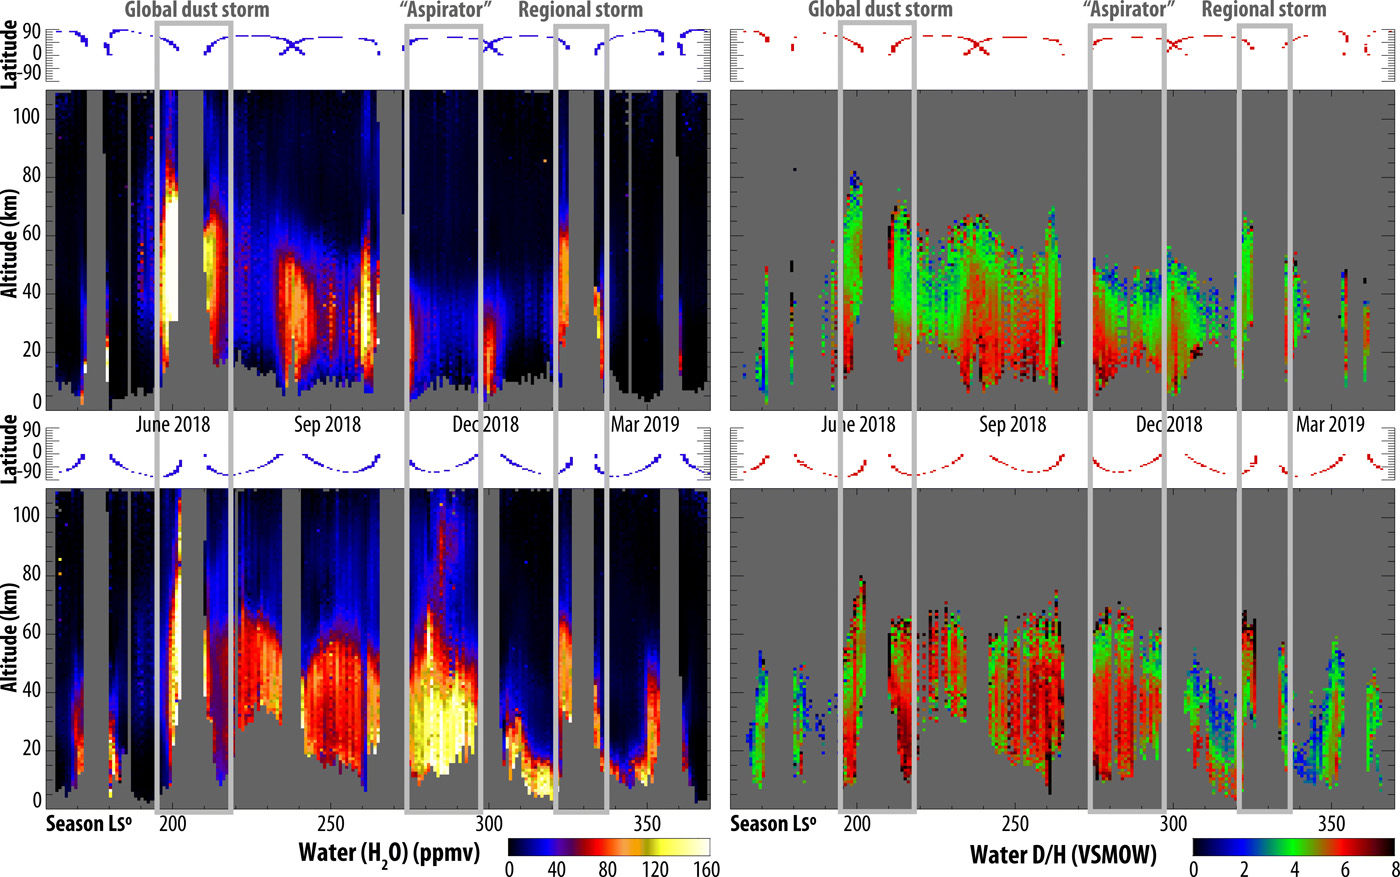
Science Advance 10 Feb 2021, https://doi.org/10.1126/sciadv.abe4386
Oleg Korablev, View ORCID ProfileKevin S. Olsen, View ORCID ProfileAlexander Trokhimovskiy, View ORCID ProfileFranck Lefèvre, View ORCID ProfileFranck Montmessin, View ORCID ProfileAnna A. Fedorova,Michael J. Toplis, View ORCID ProfileJuan Alday, View ORCID ProfileDenis A. Belyaev, View ORCID ProfileAndrey Patrakeev, View ORCID ProfileNikolay I. Ignatiev, View ORCID ProfileAlexey V. Shakun, View ORCID ProfileAlexey V. Grigoriev, View ORCID ProfileLucio Baggio, View ORCID ProfileIrbah Abdenour, View ORCID roGaetan Lacombe, Yury S. Ivanov, View ORCID ProfileShohei Aoki,View ORCID ProfileIan R. Thomas, View ORCID ProfileFrank Daerden, View ORCID ProfileBojan Ristic, View ORCID ProfileJustin T. Erwin, View ORCID ProfileManish Patel, View ORCID ProfileGiancarlo Bellucci, View ORCID ProfileJose-Juan Lopez-Moreno, Ann C. Vandaele
A major quest in Mars’ exploration has been the hunt for atmospheric gases, potentially unveiling ongoing activity of geophysical or biological origin. Here, we report the first detection of a halogen gas, HCl, which could, in theory, originate from contemporary volcanic degassing or chlorine released from gas-solid reactions. Our detections made at ~3.2 to 3.8 μm with the Atmospheric Chemistry Suite and confirmed with Nadir and Occultation for Mars Discovery instruments onboard the ExoMars Trace Gas Orbiter, reveal widely distributed HCl in the 1- to 4-ppbv range, 20 times greater than previously reported upper limits. HCl increased during the 2018 global dust storm and declined soon after its end, pointing to the exchange between the dust and the atmosphere. Understanding the origin and variability of HCl shall constitute a major advance in our appraisal of martian geo- and photochemistry.
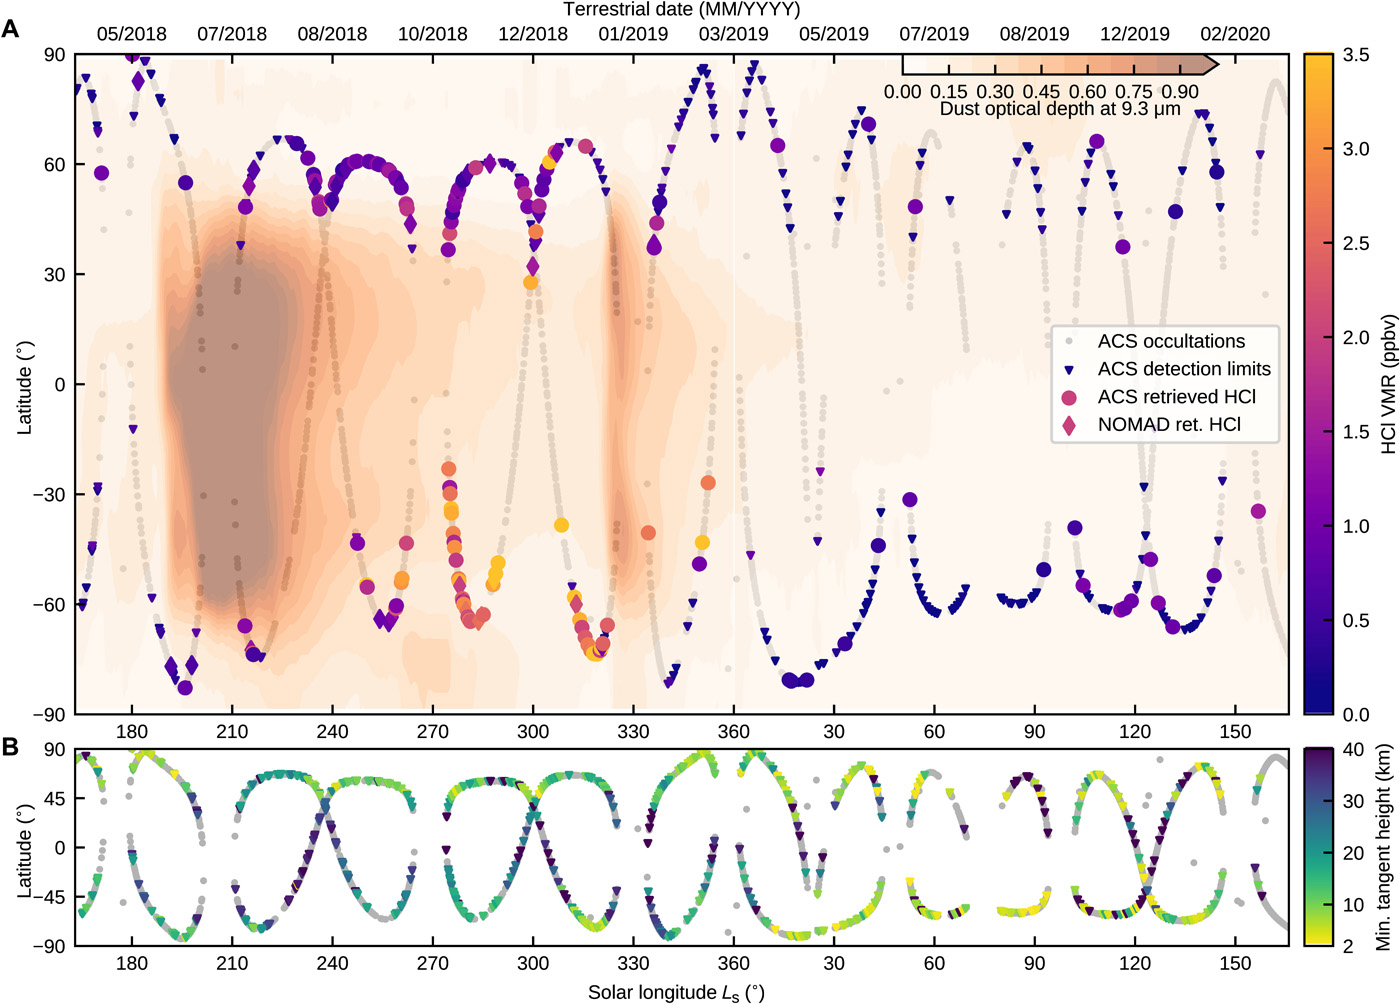
Icarus (2020) https://doi.org/10.1016/j.icarus.2020.114266
Elise W. Knutsen, Geronimo L. Villanueva, Giuliano Liuzzi, Matteo M.J. Crismani, Michael J. Mumma, Michael D. Smith, Ann Carine Vandaele, Shohei Aoki, Ian R. Thomas, Frank Daerden, Sébastien Viscardy, Justin T. Erwin, Loic Trompet, Lori Neary, Bojan Ristic, Miguel Angel Lopez-Valverde, Jose Juan Lopez-Moreno, Manish R. Patel, Giancarlo Bellucci
Methane (CH4) on Mars has attracted a great deal of attention since it was first detected in January 2003. As methane is considered a potential marker for past/present biological or geological activity, any possible detection would require evidence with strong statistical significance. Ethane (C2H6) and ethylene (C2H4) are also relevant chemical species as their shorter lifetimes in the Martian atmosphere make them excellent tracers for recent and ongoing releases. If detected, a CH4/C2Hn ratio could aid in constraining the potential source of organic production. Here we present the results of an extensive search for hydrocarbons in the Martian atmosphere in 240,000 solar occultation measurements performed by the ExoMars Trace Gas Orbiter/NOMAD instrument from April 2018 to April 2019. The observations are global, covering all longitudes and latitudes from 85°N to 85°S, and sampled from 6 to 100 km altitude with a typical vertical resolution of 2 km. There were no statistically significant detections of organics and new stringent upper limits for global ethane and ethylene were set at 0.1 ppbv and 0.7 ppbv, respectively. No global background level of methane was observed, obtaining an upper limit of 0.06 ppbv, in agreement with early results from ExoMars (Korablev et al., 2019). Dedicated searches for localized plumes at more than 2000 locations provided no positive detections, implying that if methane were released in strong and rapid events, the process would have to be sporadic.
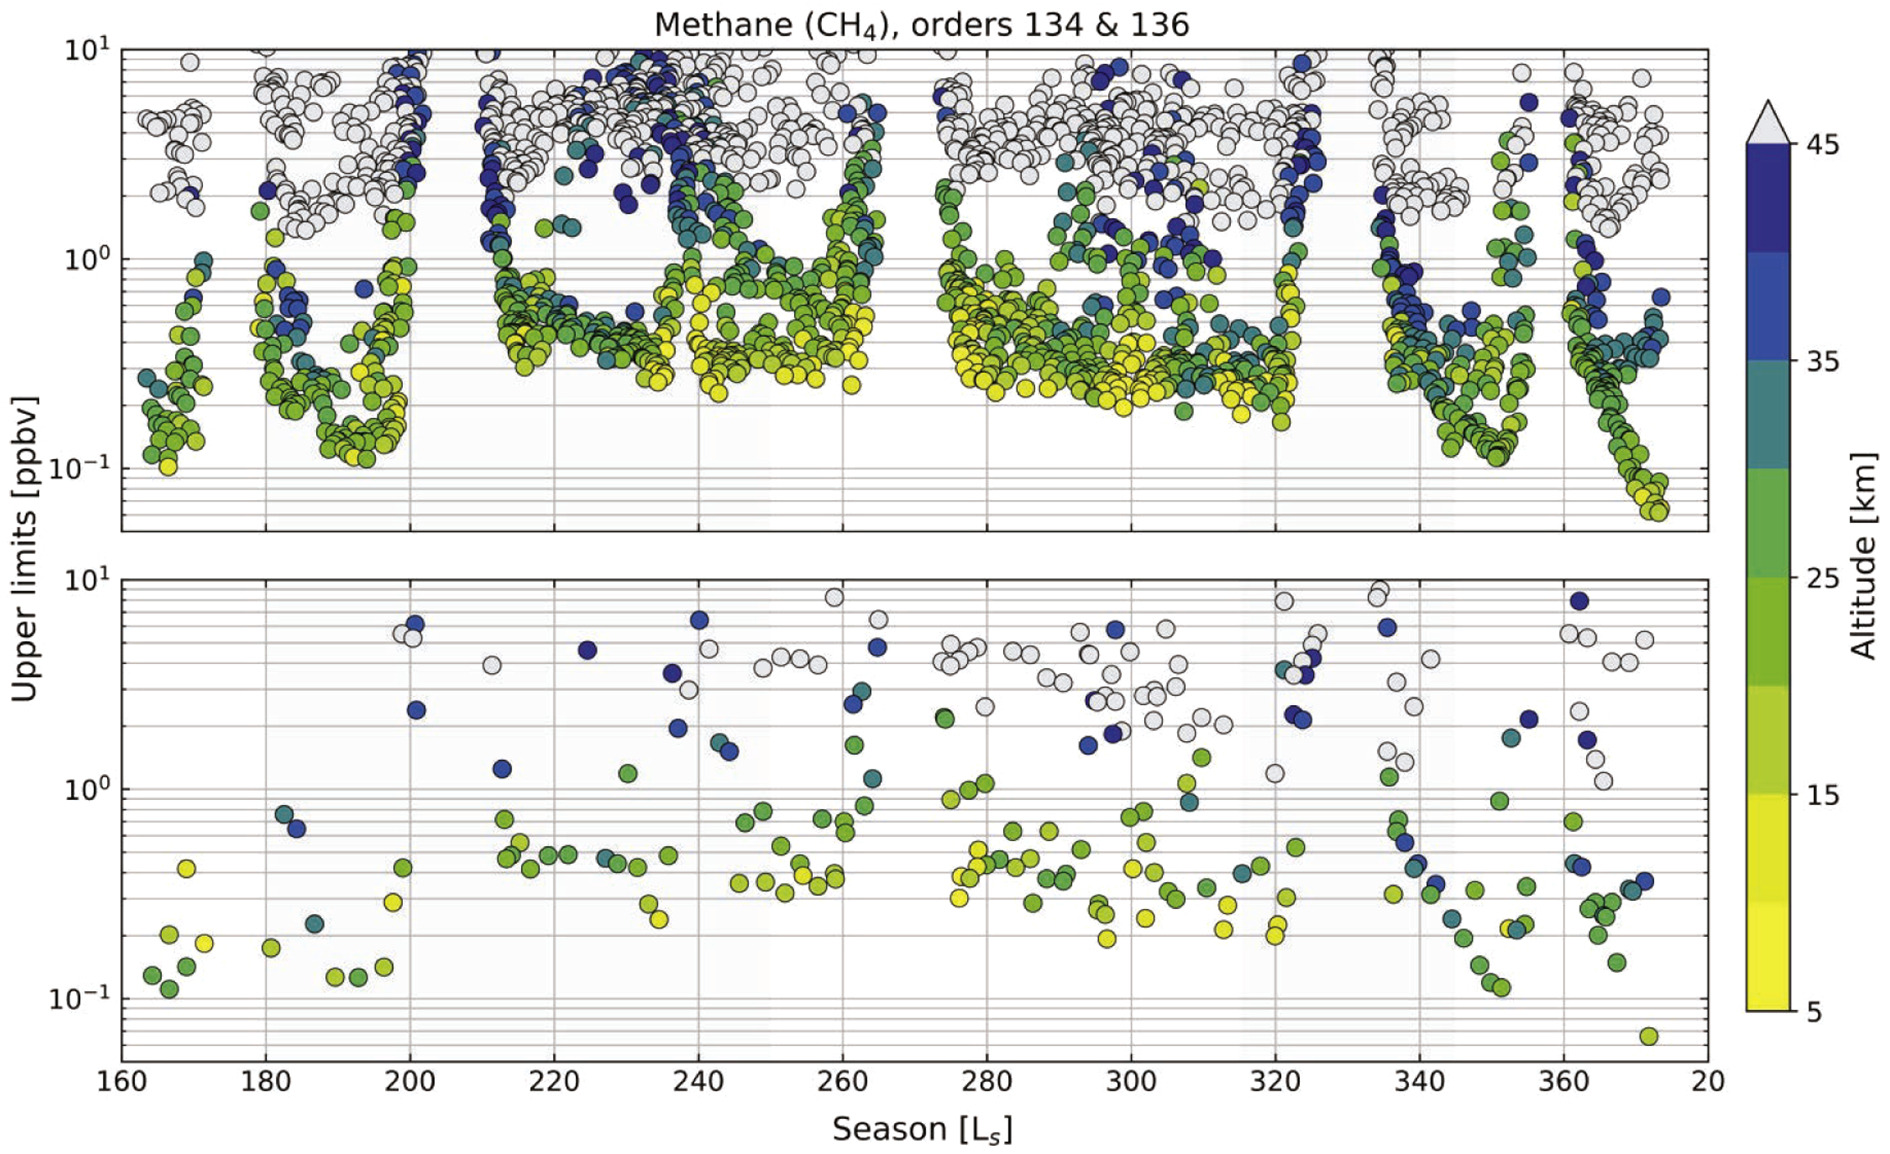
JQSRT (2021), https://doi.org/10.1016/j.jqsrt.2020.107361.
Frédéric Schmidt, Guillaume Cruz Mermy, Justin Erwin, Séverine Robert, Lori Neary, Ian R. Thomas, Frank Daerden, Bojan Ristic, Manish R. Patel, Giancarlo Bellucci, Jose-Juan Lopez-Moreno, Ann-Carine Vandaele
One of the main difficulties to analyze modern spectroscopic datasets is due to the large amount of data. For example, in atmospheric transmittance spectroscopy, the solar occultation channel (SO) of the NOMAD instrument onboard the ESA ExoMars2016 satellite called Trace Gas Orbiter (TGO) had produced ~ 10 millions of spectra in ~ 20000 acquisition sequences since the beginning of the mission in April 2018 until 15 January 2020. Other datasets are even larger with ~ billions of spectra for OMEGA onboard Mars Express or CRISM onboard Mars Reconnaissance Orbiter. Usually, new lines are discovered after a long iterative process of model fitting and manual residual analysis. Here we propose a new method based on unsupervised machine learning, to automatically detect new minor species. Although precise quantification is out of scope, this tool can also be used to quickly summarize the dataset, by giving few endmembers (”source”) and their abundances.
The methodology is the following: we proposed a way to approximate the dataset non-linearity by a linear mixture of abundance and source spectra (endmembers). We used unsupervised source separation in form of non-negative matrix factorization to estimate those quantities. Several methods are tested on synthetic and simulation data. Our approach is dedicated to detect minor species spectra rather than precisely quantifying them. On synthetic example, this approach is able to detect chemical compounds present in form of 100 hidden spectra out of 104, at 1.5 times the noise level. Results on simulated spectra of NOMAD-SO targeting CH4 show that detection limits goes in the range of 100–500 ppt in favorable conditions. Results on real martian data from NOMAD-SO show that CO2 and H2O are present, as expected, but CH4 is absent. Nevertheless, we confirm a set of new unexpected lines in the database, attributed by ACS instrument Team to the CO2 magnetic dipole.
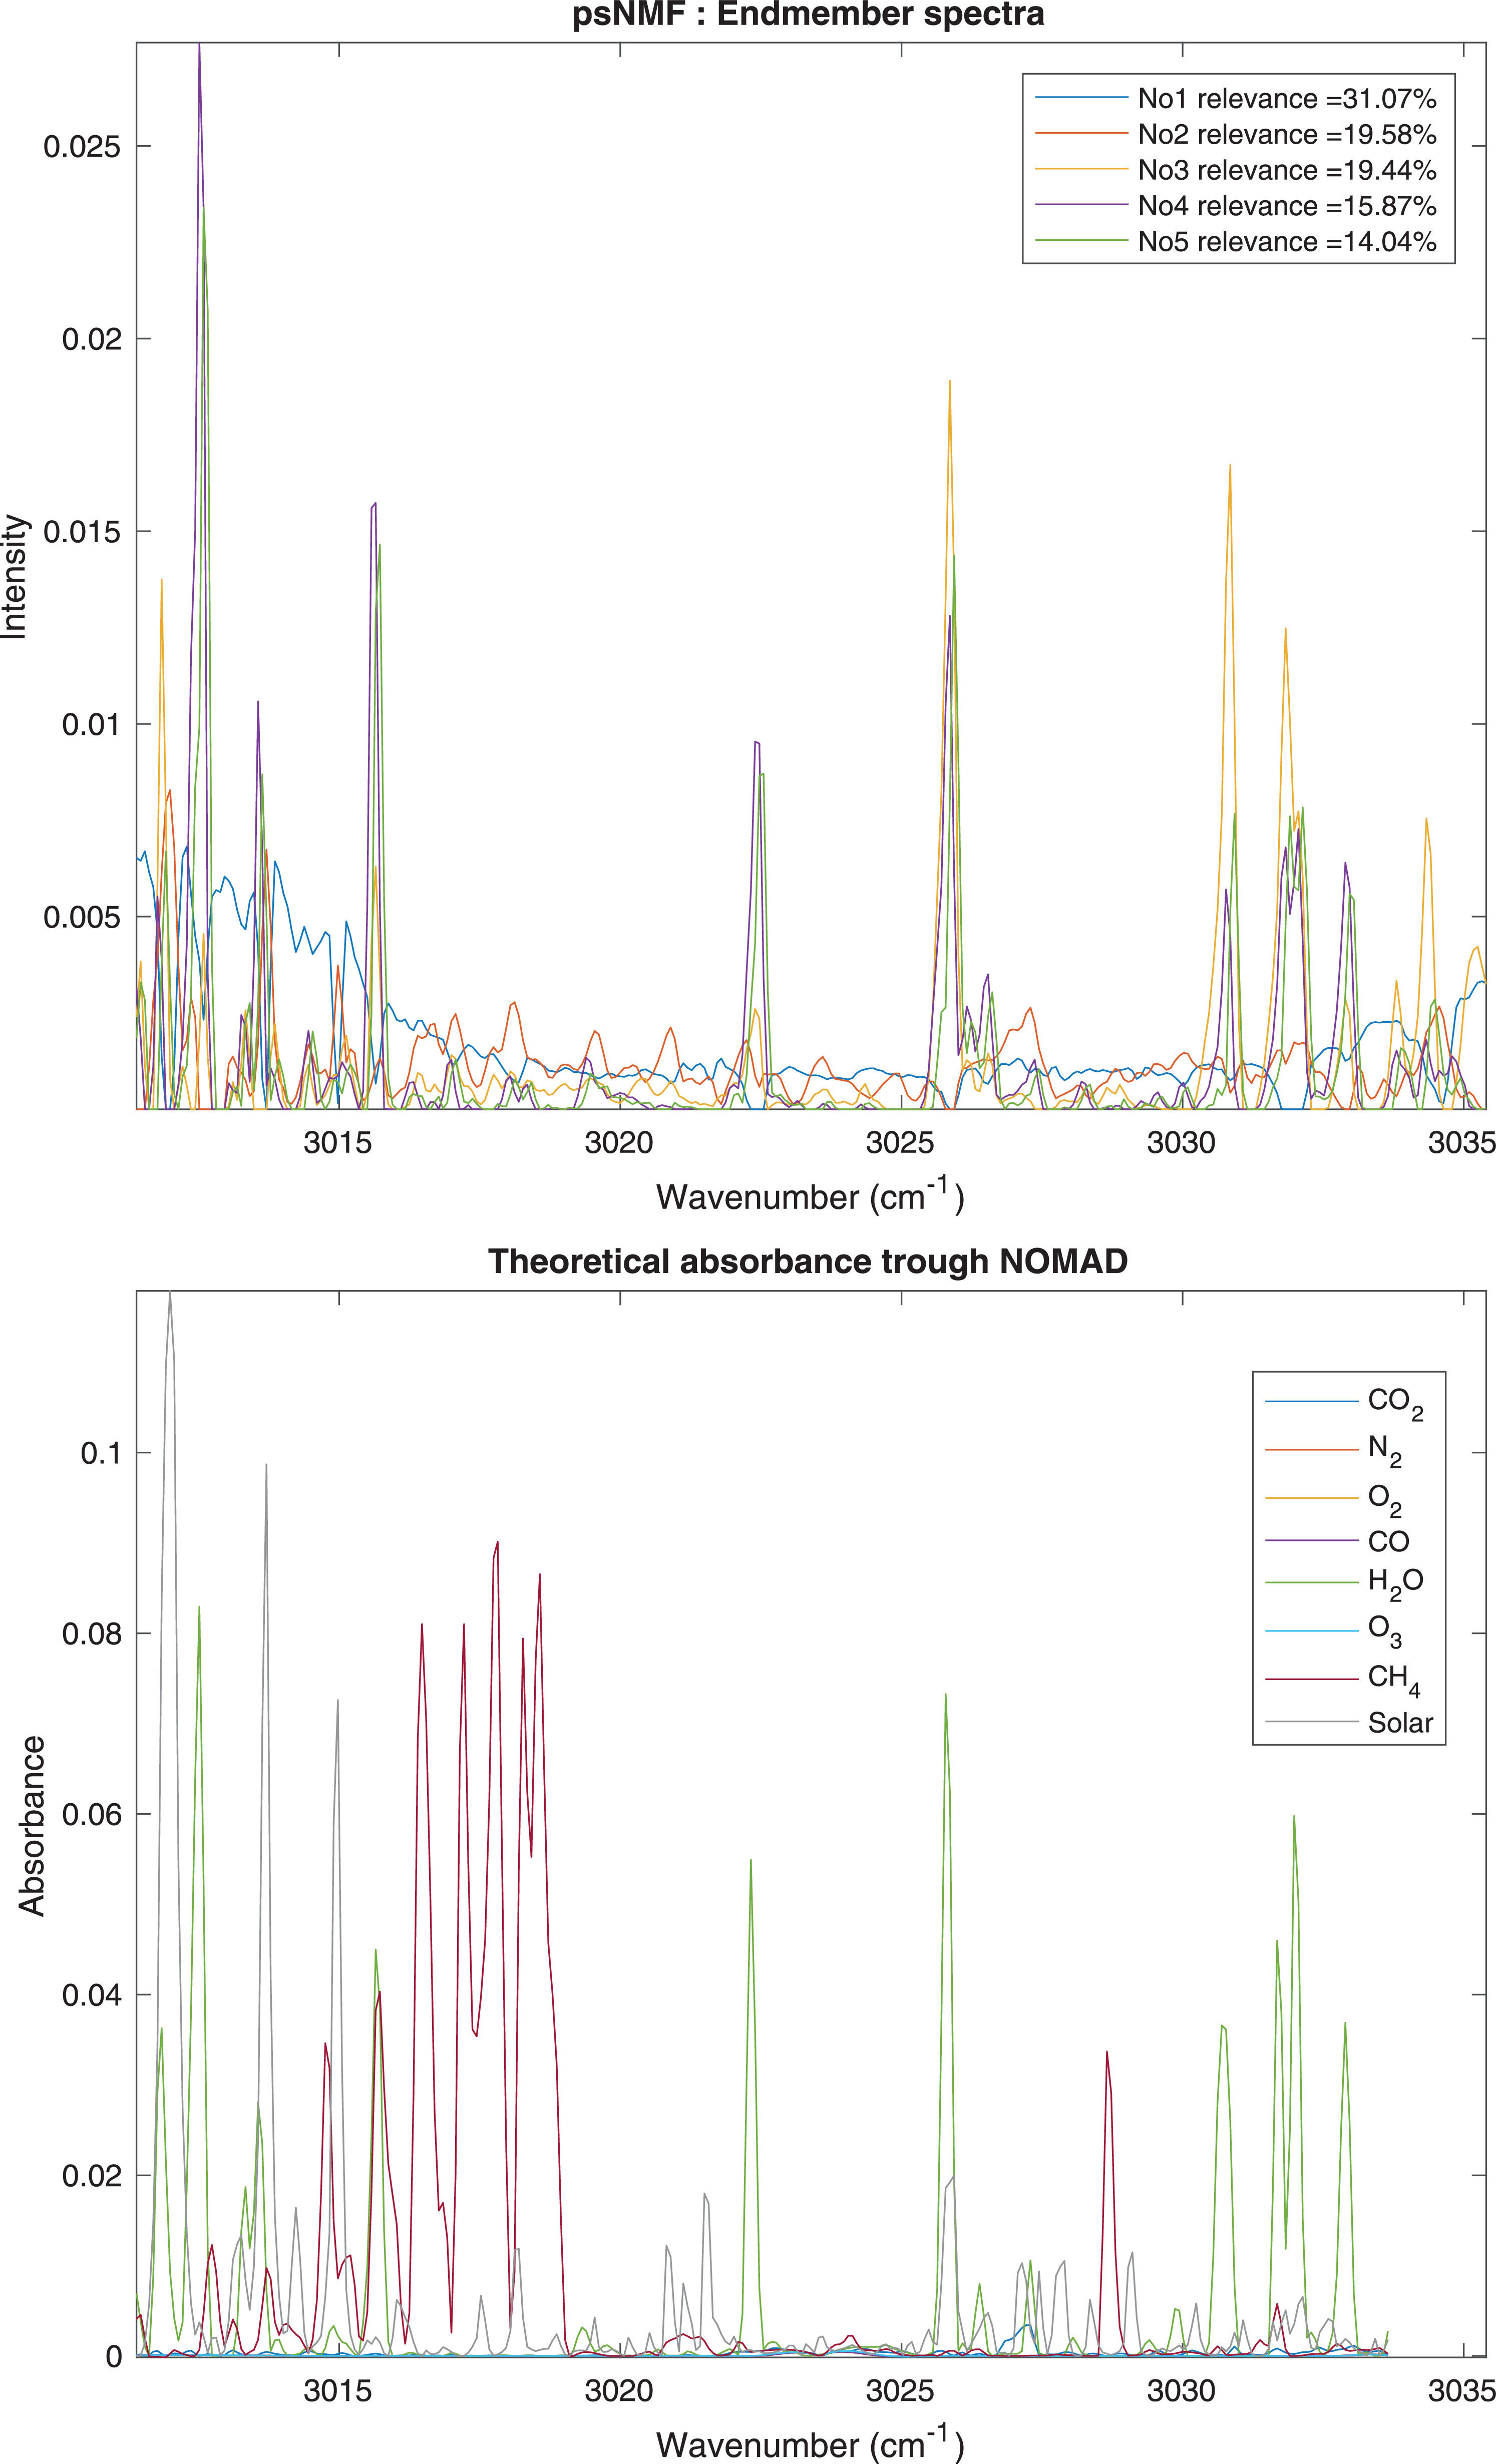
Results of the psNMF algorithm for the diffraction order 134 for Ns=5. The source 1 is identified to the background level (continuum misestimation), the sources 3, 4 and 5 are identified to H2O. The sources 2 present unmodeled lines that are not present in the spectroscopic database. These lines has been first detected in the ACS instrument data and attributed to CO2 magnetic dipole transition. No source seems to be related to CH4.
Nature Astronomy (2020), https://doi.org/10.1038/s41550-020-1123-2, https://orfeo.belnet.be/handle/internal/7691
Gérard, J.-C.,; Aoki, S.; Willame, Y.; Gkouvelis, L.; Depiesse, C.; Thomas, I.R. | Ristic, B.; Vandaele, A.C.; Daerden, F.; Hubert, B.; Mason, J.; Patel, M.R.; López-Moreno, J.-J.; Bellucci, G.; López-Valverde, M.A.; Beeckman, B.
The oxygen emission at 557.7 nm is a ubiquitous component of the spectrum of the terrestrial polar aurora and the reason for its usual green colour. It is also observed as a thin layer of glow surrounding the Earth near 90 km altitude in the dayside atmosphere but it has so far eluded detection in other planets. Here we report dayglow observations of the green line outside the Earth. They have been performed with the Nadir and Occultation for MArs Discovery ultraviolet and visible spectrometer instrument on board the European Space Agency’s ExoMars Trace Gas Orbiter. Using a special observation mode, scans of the dayside limb provide the altitude distribution of the intensity of the 557.7 nm line and its variability. Two intensity peaks are observed near 80 and 120 km altitude, corresponding to photodissociation of CO2 by solar Lyman alpha and extreme ultraviolet radiation, respectively. A weaker emission, originating from the same upper level of the oxygen atom, is observed in the near ultraviolet at 297.2 nm.These simultaneous measurements of both oxygen lines make it possible to directly derive a ratio of 16.5 between the visible and ultraviolet emissions, and thereby clarify a controversy between discordant ab initio calculations and atmospheric measurements that has persisted despite multiple efforts.This ratio is considered a standard for measurements connecting the ultraviolet and visible spectral regions. This result has consequences for the study of auroral and airglow processes and for spectral calibration.
JGR (2020), doi.org/10.1029/2019JE006250, https://orfeo.kbr.be/handle/internal/7502
Liuzzi, G.; Villanueva, G.L.; Crismani, M.M.J.; Smith, M.D.; Mumma, M.J.; Daerden, F.; Aoki, S.; Vandaele, A.C.; Clancy, R.T.; Erwin, J.; Thomas, I.; Ristic, B.; Lopez-Moreno, J.-J.; Bellucci, G.; Patel, M.R.
Observations of water ice clouds and aerosols on Mars can provide important insights into the complexity of the water cycle. Recent observations have indicated an important link between dust activity and the water cycle, as intense dust activity can significantly raise the hygropause, and subsequently increase the escape of water after dissociation in the upper atmosphere. Here present observations from Nadir and Occultation for MArs Discovery/Trace Gas Orbiter that investigate the variation of water ice clouds in the perihelion season of Mars year 34 (April 2018–2019), their diurnal and seasonal behavior, and the vertical structure and microphysical properties of water ice and dust. These observations reveal the recurrent presence of a layer of mesospheric water ice clouds subsequent to the 2018 global dust storm. We show that this layer rose from 45 to 80 km in altitude on a time scale of days from heating in the lower atmosphere due to the storm. In addition, we demonstrate that there is a strong dawn‐dusk asymmetry in water ice abundance, related to nighttime nucleation and subsequent daytime sublimation. Water ice particle sizes are retrieved consistently and exhibit sharp vertical gradients (from 0.1 to 4.0 μm), as well as mesospheric differences between the global dust storm (<0.5 μm) and the 2019 regional dust storm (1.0 μm), which suggests differing water ice nucleation efficiencies. These results form the basis to advance our understanding of mesospheric water ice clouds on Mars, and further constrain the interactions between water ice and dust in the middle atmosphere.
Icarus (2020), https://doi.org/10.1016/j.icarus.2020.113707, https://arxiv.org/abs/2003.02184
A. Cardesin-Moinelo, B. Geiger, G. Lacombe, B. Ristic, M. Costa, D. Titov, H. Svedhem, J. Marin-Yaseli, D. Merritt, P. Martin, M.A. Lopez-Valverde
Two spacecraft launched and operated by the European Space Agency are currently performing observations in Mars orbit. For >15 years Mars Express has been conducting global surveys of the surface, the atmosphere and the plasma environment of the Red Planet. The Trace Gas Orbiter, the first element of the ExoMars programme, began its science phase in 2018 focusing on investigations of the atmospheric composition with unprecedented sensitivity as well as surface and subsurface studies. The coordination of observation programmes of both spacecraft aims at cross calibration of the instruments and exploitation of new opportunities provided by the presence of two spacecraft whose science operations are performed by two closely collaborating teams at the European Space Astronomy Centre (ESAC).
JGR (2019) https://doi.org/10.1029/2019JE006109, https://orfeo.kbr.be/handle/internal/7439
Aoki, S.; Vandaele, A.C.; Daerden, F.; Villanueva, G.L.; Liuzzi, G.; Thomas, I.R.; Erwin, J.T.; Trompet, L.; Robert, S.; Neary, L.; Viscardy, S.; Clancy, R.T.; Smith, M.D.; Lopez‐Valverde, M.A.; Hill, B.; Ristic, B.; Patel, M.R.; Bellucci, G.; Lopez‐Moreno, J.-J.; the NOMAD team
It has been suggested that dust storms efficiently transport water vapor from the near‐surface to the middle atmosphere on Mars. Knowledge of the water vapor vertical profile during dust storms is important to understand water escape. During Martian Year 34, two dust storms occurred on Mars: a global dust storm (June to mid‐September 2018) and a regional storm (January 2019). Here we present water vapor vertical profiles in the periods of the two dust storms (Ls = 162–260° and Ls = 298–345°) from the solar occultation measurements by Nadir and Occultation for Mars Discovery (NOMAD) onboard ExoMars Trace Gas Orbiter (TGO). We show a significant increase of water vapor abundance in the middle atmosphere (40–100 km) during the global dust storm. The water enhancement rapidly occurs following the onset of the storm (Ls~190°) and has a peak at the most active period (Ls~200°). Water vapor reaches very high altitudes (up to 100 km) with a volume mixing ratio of ~50 ppm. The water vapor abundance in the middle atmosphere shows high values consistently at 60°S‐60°N at the growth phase of the dust storm (Ls = 195°–220°), and peaks at latitudes greater than 60°S at the decay phase (Ls = 220°–260°). This is explained by the seasonal change of meridional circulation: from equinoctial Hadley circulation (two cells) to the solstitial one (a single pole‐to‐pole cell). We also find a conspicuous increase of water vapor density in the middle atmosphere at the period of the regional dust storm (Ls = 322–327°), in particular at latitudes greater than 60°S.
Aircraft Engineering and Aerospace Technology (2019), https://doi.org/10.1108/AEAT-12-2018-0310
Laszlo Hetey, Eddy Neefs, Ian Thomas, Joe Zender, Ann-Carine Vandaele, Sophie Berkenbosch, Bojan Ristic, Sabrina Bonnewijn, Sofie Delanoye, Mark Leese, Jon Mason, Manish Patel
Icarus (2019), https://doi.org/10.1029/2019GL084354
L. Neary, F. Daerden, S. Aoki, J. Whiteway, R. T. Clancy, M. Smith, S. Viscardy, J. T. Erwin, I. R. Thomas, G. Villanueva, G. Liuzzi, M. Crismani, M. Wolff, S. R. Lewis, J. A. Holmes, M. R. Patel, M. Giuranna, C. Depiesse, A. Piccialli, S. Robert, L. Trompet, Y. Willame, B. Ristic, A. C. Vandaele
The Nadir and Occultation for MArs Discovery (NOMAD) instrument on board ExoMars Trace Gas Orbiter (TGO) measured a large increase in water vapor at altitudes in the range of 40-100 km during the 2018 global dust storm on Mars. Using a three-dimensional general circulation model, we examine the mechanism responsible for the enhancement of water vapor in the upper atmosphere. Experiments with different prescribed vertical profiles of dust show that when more dust is present higher in the atmosphere the temperature increases and the amount of water ascending over the tropics is not limited by saturation until reaching heights of 70-100 km. The warmer temperatures allow more water to ascend to the mesosphere. Photochemical simulations show a strong increase in high-altitude atomic hydrogen following the high-altitude water vapor increase by a few days.
Ann Carine Vandaele, Oleg Korablev, Frank Daerden, Shohei Aoki, Ian R. Thomas, Francesca Altieri, Miguel López-Valverde, Geronimo Villanueva, Giuliano Liuzzi, Michael D. Smith, Justin T. Erwin, Loïc Trompet, Anna A. Fedorova, Franck Montmessin, Alexander Trokhimovskiy, Denis A. Belyaev, Nikolay I. Ignatiev, Mikhail Luginin, Kevin S. Olsen, Lucio Baggio, Juan Alday, Jean-Loup Bertaux, Daria Betsis, David Bolsée, R. Todd Clancy, Edward Cloutis, Cédric Depiesse, Bernd Funke, Maia Garcia-Comas, Jean-Claude Gérard, Marco Giuranna, Francisco Gonzalez-Galindo, Alexey V. Grigoriev, Yuriy S. Ivanov, Jacek Kaminski, Ozgur Karatekin, Franck Lefèvre, Stephen Lewis, Manuel López-Puertas, Arnaud Mahieux, Igor Maslov, Jon Mason, Michael J. Mumma, Lori Neary, Eddy Neefs, Andrey Patrakeev, Dmitry Patsaev, Bojan Ristic, Séverine Robert, Frédéric Schmidt, Alexey Shakun, Nicholas A. Teanby, Sébastien Viscardy, Yannick Willame, James Whiteway, Valérie Wilquet, Michael J. Wolff, Giancarlo Bellucci, Manish R. Patel, Jose-Juan López-Moreno, François Forget, Colin F. Wilson, Håkan Svedhem, Jorge L. Vago, Daniel Rodionov, NOMAD Science Team & ACS Science Team
Global dust storms on Mars are rare but can affect the Martian atmosphere for several months. They can cause changes in atmospheric dynamics and inflation of the atmosphere, primarily owing to solar heating of the dust. In turn, changes in atmospheric dynamics can affect the distribution of atmospheric water vapour, with potential implications for the atmospheric photochemistry and climate on Mars. Recent observations of the water vapour abundance in the Martian atmosphere during dust storm conditions revealed a high-altitude increase in atmospheric water vapour that was more pronounced at high northern latitudes, as well as a decrease in the water column at low latitudes. Here we present concurrent, high-resolution measurements of dust, water and semiheavy water (HDO) at the onset of a global dust storm, obtained by the NOMAD and ACS instruments onboard the ExoMars Trace Gas Orbiter. We report the vertical distribution of the HDO/H2O ratio (D/H) from the planetary boundary layer up to an altitude of 80 kilometres. Our findings suggest that before the onset of the dust storm, HDO abundances were reduced to levels below detectability at altitudes above 40 kilometres. This decrease in HDO coincided with the presence of water-ice clouds. During the storm, an increase in the abundance of H2O and HDO was observed at altitudes between 40 and 80 kilometres. We propose that these increased abundances may be the result of warmer temperatures during the dust storm causing stronger atmospheric circulation and preventing ice cloud formation, which may confine water vapour to lower altitudes through gravitational fall and subsequent sublimation of ice crystals. The observed changes in H2O and HDO abundance occurred within a few days during the development of the dust storm, suggesting a fast impact of dust storms on the Martian atmosphere.
Oleg Korablev, Ann Carine Vandaele, Franck Montmessin, Anna A. Fedorova, Alexander Trokhimovskiy, François Forget, Franck Lefèvre, Frank Daerden, Ian R. Thomas, Loïc Trompet, Justin T. Erwin, Shohei Aoki, Séverine Robert, Lori Neary, Sébastien Viscardy, Alexey V. Grigoriev, Nikolay I. Ignatiev, Alexey Shakun, Andrey Patrakeev, Denis A. Belyaev, Jean-Loup Bertaux, Kevin S. Olsen, Lucio Baggio, Juan Alday, Yuriy S. Ivanov, Bojan Ristic, Jon Mason, Yannick Willame, Cédric Depiesse, Laszlo Hetey, Sophie Berkenbosch, Roland Clairquin, Claudio Queirolo, Bram Beeckman, Eddy Neefs, Manish R. Patel, Giancarlo Bellucci, Jose-Juan López-Moreno, Colin F. Wilson, Giuseppe Etiope, Lev Zelenyi, Håkan Svedhem, Jorge L. Vago & The ACS and NOMAD Science Teams
The detection of methane on Mars has been interpreted as indicating that geochemical or biotic activities could persist on Mars today. A number of different measurements of methane show evidence of transient, locally elevated methane concentrations and seasonal variations in background methane concentrations. These measurements, however, are difficult to reconcile with our current understanding of the chemistry and physics of the Martian atmosphere, which—given methane’s lifetime of several centuries—predicts an even, well mixed distribution of methane. Here we report highly sensitive measurements of the atmosphere of Mars in an attempt to detect methane, using the ACS and NOMAD instruments onboard the ESA-Roscosmos ExoMars Trace Gas Orbiter from April to August 2018. We did not detect any methane over a range of latitudes in both hemispheres, obtaining an upper limit for methane of about 0.05 parts per billion by volume, which is 10 to 100 times lower than previously reported positive detections. We suggest that reconciliation between the present findings and the background methane concentrations found in the Gale crater would require an unknown process that can rapidly remove or sequester methane from the lower atmosphere before it spreads globally.
Icarus, Vol. 321, Issue 11, 670-691, DOI: 10.1016/j.icarus.2018.09.021. (2019)
Liuzzi, G.; Villanueva, G.L.; Mumma, M.J.; Smith, M.D.; Daerden, F.; Ristic, B.; Thomas, I.; Vandaele, A.C.; Patel, M.R.; Lopez-Moreno, J.-J.; Bellucci, G.
The Nadir and Occultation for MArs Discovery instrument (NOMAD), onboard the ExoMars Trace Gas Orbiter (TGO) spacecraft was conceived to observe Mars in solar occultation, nadir, and limb geometries, and will be able to produce an outstanding amount of diverse data, mostly focused on properties of the atmosphere. The infrared channels of the instrument operate by combining an echelle grating spectrometer with an Acousto-Optical Tunable Filter (AOTF). Using in-flight data, we characterized the instrument performance and parameterized its calibration. In particular: an accurate frequency calibration was achieved, together with its variability due to thermal effects on the grating. The AOTF properties and transfer function were also quantified, and we developed and tested a realistic method to compute the spectral continuum transmitted through the coupled grating and AOTF system. The calibration results enabled unprecedented insights into the important problem of the sensitivity of NOMAD to methane abundances in the atmosphere. We also deeply characterized its performance under realistic conditions of varying aerosol abundances, diverse albedos and changing illumination conditions as foreseen over the nominal mission. The results show that, in low aerosol conditions, NOMAD single spectrum, 1σ sensitivity to CH4 is around 0.33 ppbv at 20 km of altitude when performing solar occultations, and better than 1 ppbv below 30 km. In dusty conditions, we show that the sensitivity drops to 0 below 10 km. In Nadir geometry, results demonstrate that NOMAD will be able to produce seasonal maps of CH4 with a sensitivity around 5 ppbv over most of planet's surface with spatial integration over 5 × 5° bins. Results show also that such numbers can be improved by a factor of ~10 to ~30 by data binning. Overall, our results quantify NOMAD's capability to address the variable aspects of Martian climate.
Space Science Reviews, Vol. 214, Issue 5, A80, DOI: 10.1007/s11214-018-0517-2. (2018)
Vandaele, A.C.; Lopez-Moreno, J.-J.; Patel, M.R.; Bellucci, G.; Daerden, F.; Ristic, B.; Robert, S.; Thomas, I.R.; Wilquet, V.; Allen, M.; Alonso-Rodrigo, G.; Altieri, F.; Aoki, S.; Bolsée, D.; Clancy, T.; Cloutis, E.; Depiesse, C.; Drummond, R.; Fedorova, A.; Formisano, V.; Funke, B.; González-Galindo, F.; Geminale, A.; Gérard, J.-C.; Giuranna, M.; Hetey, L.; Ignatiev, N.; Kaminski, J.; Karatekin, O.; Kasaba, Y.; Leese, M.; Lefèvre, F.; Lewis, S.R.; López-Puertas, M.; López-Valverde, M.; Mahieux, A.; Mason, J.; McConnell, J.; Mumma, M.; Neary, L.; Neefs, E.; Renotte, E.; Rodriguez-Gomez, J.; Sindoni, G.; Smith, M.; Stiepen, A.; Trokhimovsky, A.; Vander Auwera, J.; Villanueva, G.; Viscardy, S.; Whiteway, J.; Willame, Y.; Wolff, M.; the NOMAD Team
The NOMAD (“Nadir and Occultation for MArs Discovery”) spectrometer suite on board the ExoMars Trace Gas Orbiter (TGO) has been designed to investigate the composition of Mars’ atmosphere, with a particular focus on trace gases, clouds and dust. The detection sensitivity for trace gases is considerably improved compared to previous Mars missions, compliant with the science objectives of the TGO mission. This will allow for a major leap in our knowledge and understanding of the Martian atmospheric composition and the related physical and chemical processes. The instrument is a combination of three spectrometers, covering a spectral range from the UV to the mid-IR, and can perform solar occultation, nadir and limb observations. In this paper, we present the science objectives of the instrument and explain the technical principles of the three spectrometers. We also discuss the expected performance of the instrument in terms of spatial and temporal coverage and detection sensitivity.
Space Sci Rev (2018) 214: 29. https://doi.org/10.1007/s11214-017-0463-4 http://oro.open.ac.uk/54980/1/Valverde_TGO_upper_atmosphere_SSR_2018_as_revised.pdf
Miguel A. López-Valverde, Jean-Claude Gerard, Francisco González-Galindo, Ann-Carine Vandaele, Ian Thomas, Oleg Korablev, Nikolai Ignatiev, Anna Fedorova, Franck Montmessin, Anni Määttänen, Sabrina Guilbon, Franck Lefevre, Manish R. Patel, Sergio Jiménez-Monferrer, Maya García-Comas, Alejandro Cardesin, Colin F. Wilson, R. T. Clancy, Armin Kleinböhl, Daniel J. McCleese, David M. Kass, Nick M. Schneider, Michael S. Chaffin, José Juan López-Moreno, Julio Rodríguez
The Martian mesosphere and thermosphere, the region above about 60 km, is not the primary target of the ExoMars 2016 mission but its Trace Gas Orbiter (TGO) can explore it and address many interesting issues, either in-situ during the aerobraking period or remotely during the regular mission. In the aerobraking phase TGO peeks into thermospheric densities and temperatures, in a broad range of latitudes and during a long continuous period. TGO carries two instruments designed for the detection of trace species, NOMAD and ACS, which will use the solar occultation technique. Their regular sounding at the terminator up to very high altitudes in many different molecular bands will represent the first time that an extensive and precise dataset of densities and hopefully temperatures are obtained at those altitudes and local times on Mars. But there are additional capabilities in TGO for studying the upper atmosphere of Mars, and we review them briefly. Our simulations suggest that airglow emissions from the UV to the IR might be observed outside the terminator. If eventually confirmed from orbit, they would supply new information about atmospheric dynamics and variability. However, their optimal exploitation requires a special spacecraft pointing, currently not considered in the regular operations but feasible in our opinion. We discuss the synergy between the TGO instruments, specially the wide spectral range achieved by combining them. We also encourage coordinated operations with other Mars-observing missions capable of supplying simultaneous measurements of its upper atmosphere.
Icarus, Vol. 300, 458-476, DOI: 10.1016/j.icarus.2017.09.028. (2018)
Neary, L.; Daerden, F.
GEM-Mars is a gridpoint-based three-dimensional general circulation model (GCM) of the Mars atmosphere extending from the surface to approximately 150 km based on the GEM (Global Environmental Multiscale) model, part of the operational weather forecasting and data assimilation system for Canada. After the initial modification for Mars, the model has undergone considerable changes. GEM-Mars is now based on GEM 4.2.0 and many physical parameterizations have been added for Mars-specific atmospheric processes and surface-atmosphere exchange. The model simulates interactive carbon dioxide-, dust-, water- and atmospheric chemistry cycles. Dust and water ice clouds are radiatively active. Size distributed dust is lifted by saltation and dust devils. The model includes 16 chemical species (CO2, Argon, N2, O2, CO, H2O, CH4, O3, O(1D), O, H, H2, OH, HO2, H2O2 and O2(a1∆g)) and has fully interactive photochemistry (15 reactions) and gas-phase chemistry (31 reactions). GEM-Mars provides a good simulation of the water and ozone cycles. A variety of other passive tracers can be included for dedicated studies, such as the emission of methane. The model has both a hydrostatic and non-hydrostatic formulation, and together with a flexible grid definition provides a single platform for simulations on a variety of horizontal scales. The model code is fully parallelized using OMP and MPI. Model results are evaluated by comparison to a selection of observations from instruments on the surface and in orbit, relating to atmosphere and surface temperature and pressure, dust and ice content, polar ice mass, polar argon, and global water and ozone vertical columns. GEM-Mars will play an integral part in the analysis and interpretation of data that is received by the NOMAD spectrometer on the ESA-Roskosmos ExoMars Trace Gas Orbiter. The present paper provides an overview of the current status and capabilities of the GEM-Mars model and lays the foundations for more in-depth studies in support of the NOMAD mission.
Applied Optics, Vol. 56, Issue 10, 2771-2782 (2017), DOI: 10.1364/AO.56.002771.
Patel, M.R.; Antoine, P.; Mason, J.; Leese, M.; Hathi, B.; Stevens, A.H.; Dawson, D.; Gow, J.; Ringrose, T.; Holmes, J.; Lewis, S.R.; Beghuin, D.; Van Donink, P.; Ligot, R.; Dewandel, J.-L.; Hu, D.; Bates, D.; Cole, R.; Drummond, R.; Thomas, I.R.; Depiesse, C.; Neefs, E.; Equeter, E.; Ristic, B.; Berkenbosch, S.; Bolsée, D.; Willame, Y.; Vandaele, A.C.; Lesschaeve, S.; De Vos, L.; Van Vooren, N.; Thibert, T.; Mazy, E.; Rodriguez-Gomez, J.; Morales, R.; Candini, G.P.; Pastor-Morales, M.C.; Sanz, R.; Aparicio del Moral, B.; Jeronimo-Zafra, J.-M.; Gómez-López, J.M.; Alonso-Rodrigo, G.; Pérez-Grande, I.; Cubas, J.; Gomez-Sanjuan, A.M.; Navarro-Medina, F.; Benmoussa, A.; Giordanengo, B.; Gissot, S.; Bellucci, G.; Lopez-Moreno, J.J.
NOMAD is a spectrometer suite on board the ESA/Roscosmos ExoMars Trace Gas Orbiter, which launched in March 2016. NOMAD consists of two infrared channels and one ultraviolet and visible channel, allowing the instrument to perform observations quasi-constantly, by taking nadir measurements at the day-and night-side, and during solar occultations. Here, in part 2 of a linked study, we describe the design, manufacturing, and testing of the ultraviolet and visible spectrometer channel called UVIS. We focus upon the optical design and working principle where two telescopes are coupled to a single grating spectrometer using a selector mechanism.
Zafra, J.M.J.; Mesa, R.S.; López, J.M.G.; Gómez, J.F.R.; Del Moral, B.A.; Muñoz, R.M.; Candini, G.P.; Morales, M.C.P.; Muñoz, N.R.; López-Moreno, J.J.; Vandaele, A.C.; Neefs, E.; Drummond, R.; Delanoye, S.; Berkenbosch, S.; Clairquin, R.; Ristic, B.; Maes, J.; Bonnewijn, S.; Patel, M.R.; Leese, M.
NOMAD is a spectrometer suite: UV-visible-IR spectral ranges. NOMAD is part of the payload of ESA ExoMars Trace Gas Orbiter Mission. SINBAD boards are in charge of the communication and management of the power and control between the spacecraft and the instrument channels. SINBAD development took four years, while the entire development and test required five years, a very short time to develop an instrument devoted to a space mission. The hardware of SINBAD is shown in the attached poster: developed boards, prototype boards and final models. The models were delivered to the ESA in order to testing and integration with the spacecraft.
Pastor-Morales, M.C.; Rodríguez-Gómez, J.F.; Morales-Muñoz, R.; Gómez-López, J.M.; Aparicio-del-Moral, B.; Candini, G.P.; Jerónimo-Zafra, J.M.; López-Moreno, J.J.; Robles-Muñoz, N.F.; Sanz-Mesa, R.; Neefs, E.; Vandaele, A.C.; Drummond, R.; Thomas, I.R.; Berkenbosch, S.; Clairquin, R.; Delanoye,S.; Ristic, B.; Maes, J.; Bonnewijn, S.; Patel, M.R.; Leese, M.; Mason, J.P.
The Spacecraft INterface and control Board for NomAD (SINBAD) is an electronic interface designed by the Instituto de Astrof´ısica de Andaluc´ıa (IAA-CSIC). It is part of the Nadir and Occultation for MArs Discovery instrument (NOMAD) on board in the ESA's ExoMars Trace Gas Orbiter mission. This mission was launched in March 2016. The SINBAD Flight Software (SFS) is the software embedded in SINBAD. It is in charge of managing the interfaces, devices, data, observing sequences, patching and contingencies of NOMAD. It is presented in this paper the most remarkable aspects of the SFS design, likewise the main problems and lessons learned during the software development process.
[Ian: This paper concerns VEx/SOIR, but is included here on the NOMAD website because the same algorithm is used to calibrate SO and UVIS occultations]
Applied Optics (2016) Vol. 55, Issue 32, pp. 9275 - 9281 https://doi.org/10.1364/AO.55.009275; http://pdfs.semanticscholar.org/240b/016c68c9d1f4a7b323a253fd4cbc77a18102.pdf
Loic Trompet, Arnaud Mahieux, Bojan Ristic, Séverine Robert, Valérie Wilquet, Ian R. Thomas, Ann Carine Vandaele, and Jean-Loup Bertaux
The Solar Occultation in the InfraRed (SOIR) instrument onboard the ESA Venus Express spacecraft, an infrared spectrometer sensitive from 2.2 to 4.3 μm, probed the atmosphere of Venus from June 2006 until December 2014. During this time, it performed more than 750 solar occultations of the Venus mesosphere and lower thermosphere. A new procedure has been developed for the estimation of the transmittance in order to decrease the number of rejected spectra, to check that the treated spectra are well calibrated, and to improve the quality of the calibrated spectra by reducing the noise and accurately normalizing it to the solar spectrum.
Planetary and Space Science, (2016), Vol. 124, 94-104, DOI: 10.1016/j.pss.2016.03.003.
Robert, S.; Vandaele, A.C.; Thomas, I.; Willame, Y.; Daerden, F.; Delanoye, S.; Depiesse, C.; Drummond, R.; Neefs, E.; Neary, L.; Ristic, B.; Mason, J.; Lopez-Moreno, J.-J.; Rodriguez-Gomez, J.; Patel, M.R.; Bellucci, G.; the NOMAD Team
NOMAD (Nadir and Occultation for MArs Discovery) is one of the four instruments on board the ExoMars Trace Gas Orbiter, scheduled for launch in March 2016. It consists of a suite of three high-resolution spectrometers – SO (Solar Occultation), LNO (Limb, Nadir and Occultation) and UVIS (Ultraviolet and Visible Spectrometer). Based upon the characteristics of the channels and the values of Signal-to-Noise Ratio obtained from radiometric models discussed in (Vandaele et al., 2015a and Vandaele et al., 2015b; Thomas et al., 2016), the expected performances of the instrument in terms of sensitivity to detection have been investigated. The analysis led to the determination of detection limits for 18 molecules, namely CO, H2O, HDO, C2H2, C2H4, C2H6, H2CO, CH4, SO2, H2S, HCl, HCN, HO2, NH3, N2O, NO2, OCS, O3. NOMAD should have the ability to measure methane concentrations <25 parts per trillion (ppt) in solar occultation mode, and 11 parts per billion in nadir mode. Occultation detections as low as 10 ppt could be made if spectra are averaged (Drummond et al., 2011). Results have been obtained for all three channels in nadir and in solar occultation.
Optics Express, Vol. 24, Issue 4, 3790-3805 (2016), DOI: 10.1364/OE.24.003790.
Thomas, I.R.; Vandaele, A.-C.; Robert, S.; Neefs, E.; Drummond, R.; Daerden, F.; Delanoye, S.; Ristic, B.; Berkenbosch, S.; Clairquin, R.; Maes, J.; Bonnewijn, S.; Depiesse, C.; Mahieux, A.; Trompet, L.; Neary, L.; Willame, Y.; Wilquet, V.; Nevejans, D.; Aballea, L.; Moelans, W.; De Vos, L.; Lesschaeve, S.; Van Vooren, N.; Lopez-Moreno, J.J.; Patel, M.R.; Bellucci, G.; the NOMAD Team
NOMAD is a suite of three spectrometers that will be launched in 2016 as part of the joint ESA-Roscosmos ExoMars Trace Gas Orbiter mission. The instrument contains three channels that cover the IR and UV spectral ranges and can perform solar occultation, nadir and limb observations, to detect and map a wide variety of Martian atmospheric gases and trace species. Part I of this work described the models of the UVIS channel; in this second part, we present the optical models representing the two IR channels, SO (Solar Occultation) and LNO (Limb, Nadir and Occultation), and use them to determine signal to noise ratios (SNRs) for many expected observational cases. In solar occultation mode, both the SO and LNO channel exhibit very high SNRs >5000. SNRs of around 100 were found for the LNO channel in nadir mode, depending on the atmospheric conditions, Martian surface properties, and observation geometry.
Vandaele, A.C.; Willame, Y.; Depiesse, C.; Thomas, I.R.; Robert, S.; Bolsee, D.; Patel, M.R.; Mason, J.P.; Leese, M.; Lesschaeve, S.; Antoine, P.; Daerden, F.; Delanoye, S.; Drummond, R.; Neefs, E.; Ristic, B.; Lopez-Moreno, J.J.; Bellucci, G.; the NOMAD Team
The NOMAD instrument has been designed to best fulfil the science objectives of the ExoMars Trace Gas Orbiter mission that will be launched in 2016. The instrument is a combination of three channels that cover the UV, visible and IR spectral ranges and can perform solar occultation, nadir and limb observations. In this series of two papers, we present the optical models representing the three channels of the instrument and use them to determine signal to noise levels for different observation modes and Martian conditions. In this first part, we focus on the UVIS channel, which will sound the Martian atmosphere using nadir and solar occultation viewing modes, covering the 200-650nm spectral range. High SNR levels (>1000) can easily be reached for wavelengths higher than 300nm both in solar occultation and nadir modes when considering binning. Below 300nm SNR are lower primarily because of the lower signal and the impact of atmospheric absorption.
Planetary and Space Science (2015), Vol. 119, 233, DOI: 10.1016/j.pss.2015.10.003.
Vandaele A. C.; Neefs E.; Drummond R.; Thomas I. R.; Daerden F.; Lopez-Moreno J.-J.; Rodriguez J.; Patel M. R.; Bellucci G.; Allen M.; Altieri F.; Bolsée D.; Clancy T.; Delanoye S.; Depiesse C.; Cloutis E.; Fedorova A.; Formisano V.; Funke B.; Fussen D.; Geminale A.; Gérard J.-C.; Giuranna M.; Ignatiev N.; Kaminski J.; Karatekin O.; Lefèvre F.; López-Puertas M.; López-Valverde M.; Mahieux A.; McConnell J.; Mumma M.; Neary L.; Renotte E.; Ristic B.; Robert S.; Smith M.; Trokhimovsky S.; Vander Auwera J.; Villanueva G.; Whiteway J.; Wilquet V.; Wolff M.
The NOMAD spectrometer suite on the ExoMars Trace Gas Orbiter will map the composition and distribution of Mars׳ atmospheric trace species in unprecedented detail, fulfilling many of the scientific objectives of the joint ESA-Roscosmos ExoMars Trace Gas Orbiter mission. The instrument is a combination of three channels, covering a spectral range from the UV to the IR, and can perform solar occultation, nadir and limb observations. In this paper, we present the science objectives of the instrument and how these objectives have influenced the design of the channels. We also discuss the expected performance of the instrument in terms of coverage and detection sensitivity.
Applied Optics, Vol. 54, Issue 28, 8494-8520, DOI: 10.1364/AO.54.008494.
Neefs, E.; Vandaele, A.C.; Drummond, R.; Thomas, I.R.; Berkenbosch, S.; Clairquin, R.; Delanoye, S.; Ristic, B.; Maes, J.; Bonnewijn, S.; Pieck, G.; Equeter, E.; Depiesse, C.; Daerden, F.; Van Ransbeeck, E.; Nevejans, D.; Rodriguez-Gomez, J.; Lopez-Moreno, J.-J.; Sanz, R.; Morales, R.; Candini, G.P.; Pastor-Morales, M.C.; Del Moral, B.A.; Jeronimo-Zafra, J.-M.; Gomez-Lopez, J.M.; Alonso-Rodrigo, G.; Perez-Grande, I.; Cubas, J.; Gomez-Sanjuan, A.M.; Navarro-Medina, F.; Thibert, T.; Patel, M.R.; Bellucci, G.; De Vos, L.; Lesschaeve, S.; Van Vooren, N.; Moelans, W.; Aballea, L.; Glorieux, S.; Baeke, A.; Kendall, D.; De Neef, J.; Soenen, A.; Puech, P.-Y.; Ward, J.; Jamoye, J.-F.; Diez, D.; Vicario-Arroyo, A.; Jankowski, M.
NOMAD is a spectrometer suite on board ESA’s ExoMars trace gas orbiter due for launch in January 2016. NOMAD consists of two infrared channels and one ultraviolet and visible channel allowing the instrument to perform observations quasi-constantly, by taking nadir measurements at dayside and nightside, and during solar occultations. In this paper, the design, manufacturing, and testing of the two infrared channels are described. We focus upon the optical working principle in these channels, where an echelle grating, used as a diffractive element, is combined with an acousto-optical tunable filter, used as a diffraction order sorter.