PSS (2022) https://doi.org/10.1016/j.pss.2022.105504
Yannick Willame, Cédric Depiesse, Jonathon P. Mason, Ian R. Thomas, Manish R. Patel, Brijen Hathi, Mark R. Leese, David Bolsée, Michael J. Wolff, Loïc Trompet, Ann Carine Vandaele, Arianna Piccialli, Shohei Aoki, Bojan Ristic, Eddy Neefs, Bram Beeckman, Sophie Berkenbosch, Roland Clairquin, Arnaud Mahieux, Nuno Pereira, Séverine Robert, Sébastien Viscardy, Valérie Wilquet, Frank Daerden, José Juan Lopez-Moreno, Giancarlo Bellucci
The Ultraviolet and VIsible Spectrometer (UVIS), covering the 200–650 nm range, is one of three spectrometers that comprise the NOMAD instrument on the ExoMars 2016 Trace Gas Orbiter (TGO). UVIS can operate in solar occultation, nadir and limb viewing mode and was designed to monitor ozone and aerosols in the Martian atmosphere. Here, we describe the calibration procedure to convert the UVIS raw data into a calibrated data product ready for scientific exploitation. The calibration includes the CCD offset and dark current subtraction, the wavelength assignment, the noise identification and removal, the smearing removal, and the radiance or transmittance conversion. A straylight correction, critical for some parts of the UVIS spectral range, is also applied during the data reduction process, which is described in more detail in two companion papers [Mason et al., 2022; Depiesse et al., In prep] corresponding to two different and independent methods giving consistent results. The solar occultation observations are converted into transmittance and are therefore self-calibrating, while nadir and limb measurements require an absolute radiometric calibration. A comparison with coincident nadir MRO/MARCI measurements is provided as a final validation and generally shows a ±10% agreement on the radiances measured by both instruments.
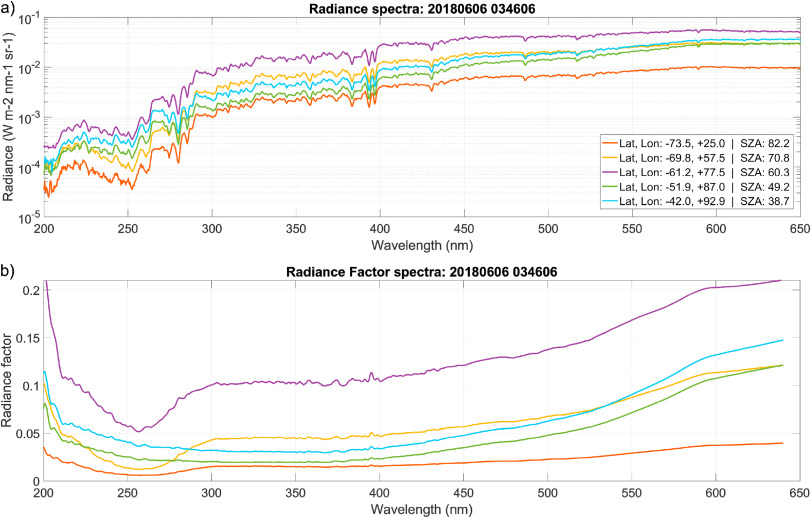
a) Example of radiance converted nadir spectra. Note the intensity difference between UV and the longer wavelength region that can reach more than 2 orders of magnitude. b) Same spectra as in the top panel but given as radiance factors. The characteristic absorption feature of the ozone Hartley band is visible between 220 and 290 nm at the polar latitudes below 60°S as expected at this period (Ls = 188.3°)