JGR (2023) https://doi.org/10.1029/2023JE008002
J. P. Mason, M. R. Patel, M. Pajola, E. D. Cloutis, J. Alday, K. S. Olsen, C. Marriner, J. A. Holmes, G. Sellers, N. Thomas, M. Almeida, M. Read, H. Nakagawa, I. R. Thomas, B. Ristic, Y. Willame, C. Depiesse, F. Daerden, A. C. Vandaele, J. J. Lopez-Moreno, G. Bellucci
Spectroscopic measurements are a powerful tool to investigate the surface composition of airless bodies and provide clues of their origin. The composition and origin of Phobos and Deimos are still unknown and are currently widely debated. We present spectroscopic measurements of Phobos and Deimos at ultraviolet and visible wavelengths (250–650 nm) made by the NOMAD-Ultraviolet and Visible Spectrometer (UVIS) on the ExoMars TGO mission. These new spectra cover multiple areas on Phobos and Deimos, and are of generally higher spectral resolution and signal-to-noise than previous spectra, and extend to lower wavelengths than most previous measurements. The UVIS spectra confirm a red-sloped spectrum lacking any strong absorption features; however, we confirm the presence of a previously identified absorption feature near 0.65 μm and tentative absorption near 0.45 μm. The observed Phobos and Deimos spectra are similar to D- and T-type asteroids, adding weight to the captured asteroid hypothesis for the moons' origins. We also find, however, that the UVIS Phobos reflectance spectra of Phobos' red unit is a relatively close match to the olivine-rich, highly shocked Mars meteorite NWA 2737, with a low overall reflectance, a red-sloped spectrum, and lack of olivine-associated absorption bands in the UVIS spectral range. This meteorite, however, exhibits spectral features at longer wavelengths that not observed in the Martian moon spectra, indicating a need for further investigation at longer wavelengths to interpret whether this material could inform our understanding of Phobos' origin.
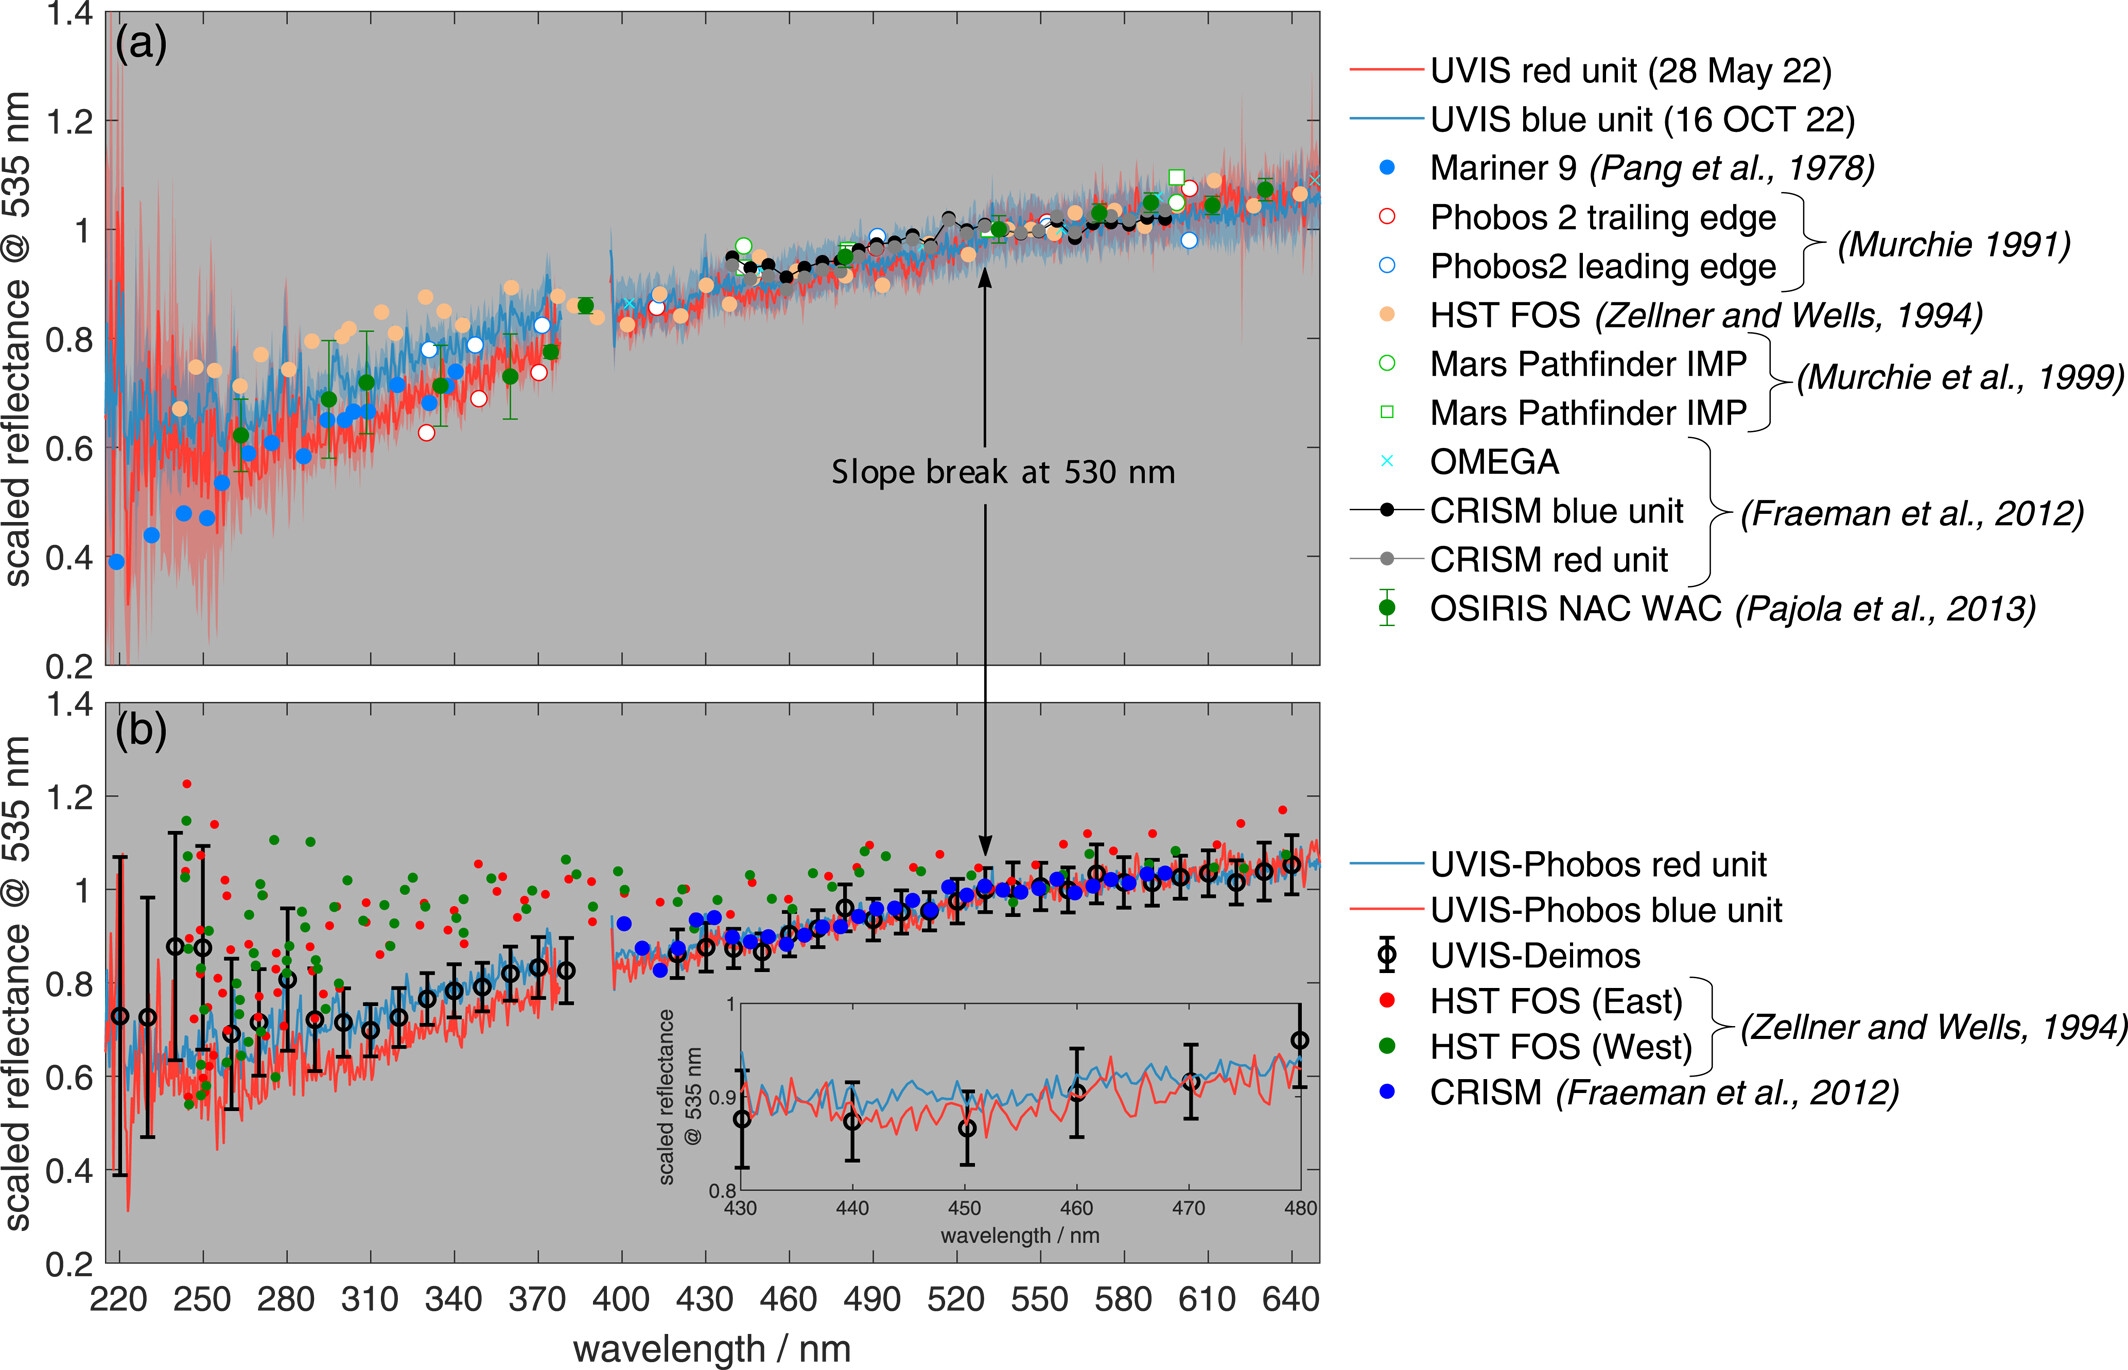
(a) Comparison of the UVIS Phobos blue unit spectrum (blue line) and red unit spectrum (red line) against those made by other instruments. The blue and red shading gives the uncertainty in the UVIS data. Also shown are the Phobos spectra measured by Mariner 9 (light blue circles), Phobos 2 leading (blue-white circles) and trailing (red-white circles) edge of Phobos, HST FOS (orange circles), IMP (green-white circles and squares), OMEGA (red crosses), the CRISM blue unit (black circles) and red unit (gray circle) and OSIRIS (dark green circles). (b) The UVIS Deimos spectra (black line) compared to other Deimos spectra measured by the, Hubble Space Telescope (HST) Faint Object Spectrograph (FOS) red and green dots and the Compact Reconnaissance Imaging Spectrometer for Mars (CRISM) (blue dots). We also show the two UVIS Phobos spectra (blue and red lines) for comparison. The inset in (b) shows a zoomed in the region around potential broad absorption centered near 0.45 μm.