JGR (2023) https://doi.org/10.1029/2023JE008014
Frank Daerden, John N. Crowley, Lori Neary, Michael D. Smith, Mark J. Loeffler, R. Todd Clancy, Michael J. Wolff, Shohei Aoki, Hideo Sagawa
Current models underestimate the highest observed ozone (O3) column densities on Mars. These estimates could be improved by including the uptake of odd hydrogen species (HOx) on water ice clouds, but the reported uptake coefficient of HO2 is likely overestimated for atmospheric conditions. This leaves a fundamental problem in Mars' atmospheric chemistry unsolved. Here, using the GEM-Mars general circulation model, we explore a range of processes involving multiple phases (gas, adsorbed and solid) that may contribute to an alternative solution. First, we focus on hydrogen peroxide (H2O2) and discuss its physical states on Mars and its chemical impact. We also conjecture its photolytic destruction in ices with model simulations and Compact Reconnaissance Imaging Spectrometer for Mars observations. Then, we include in the model all relevant (for Mars) heterogeneous reactions, both on dust and water ice, recommended by the International Union of Pure and Applied Chemistry for terrestrial atmospheric studies. We find that only the uptake of HO2 and H2O2 on dust are efficient on Mars. Finally, we find that attenuation of sunlight by water ice clouds in the calculation of photolysis rates leads to increased O3 and H2O2 abundances below the ice clouds. The combination of the proposed processes leads to O3 increases without the need for strong uptake of HO2 on ice, but it remains difficult to find a good agreement with O3 and H2O2 observations on the global scale. We provide specific recommendations for future work in observations, laboratory experiments and modeling to advance our understanding of fundamental chemistry on Mars.
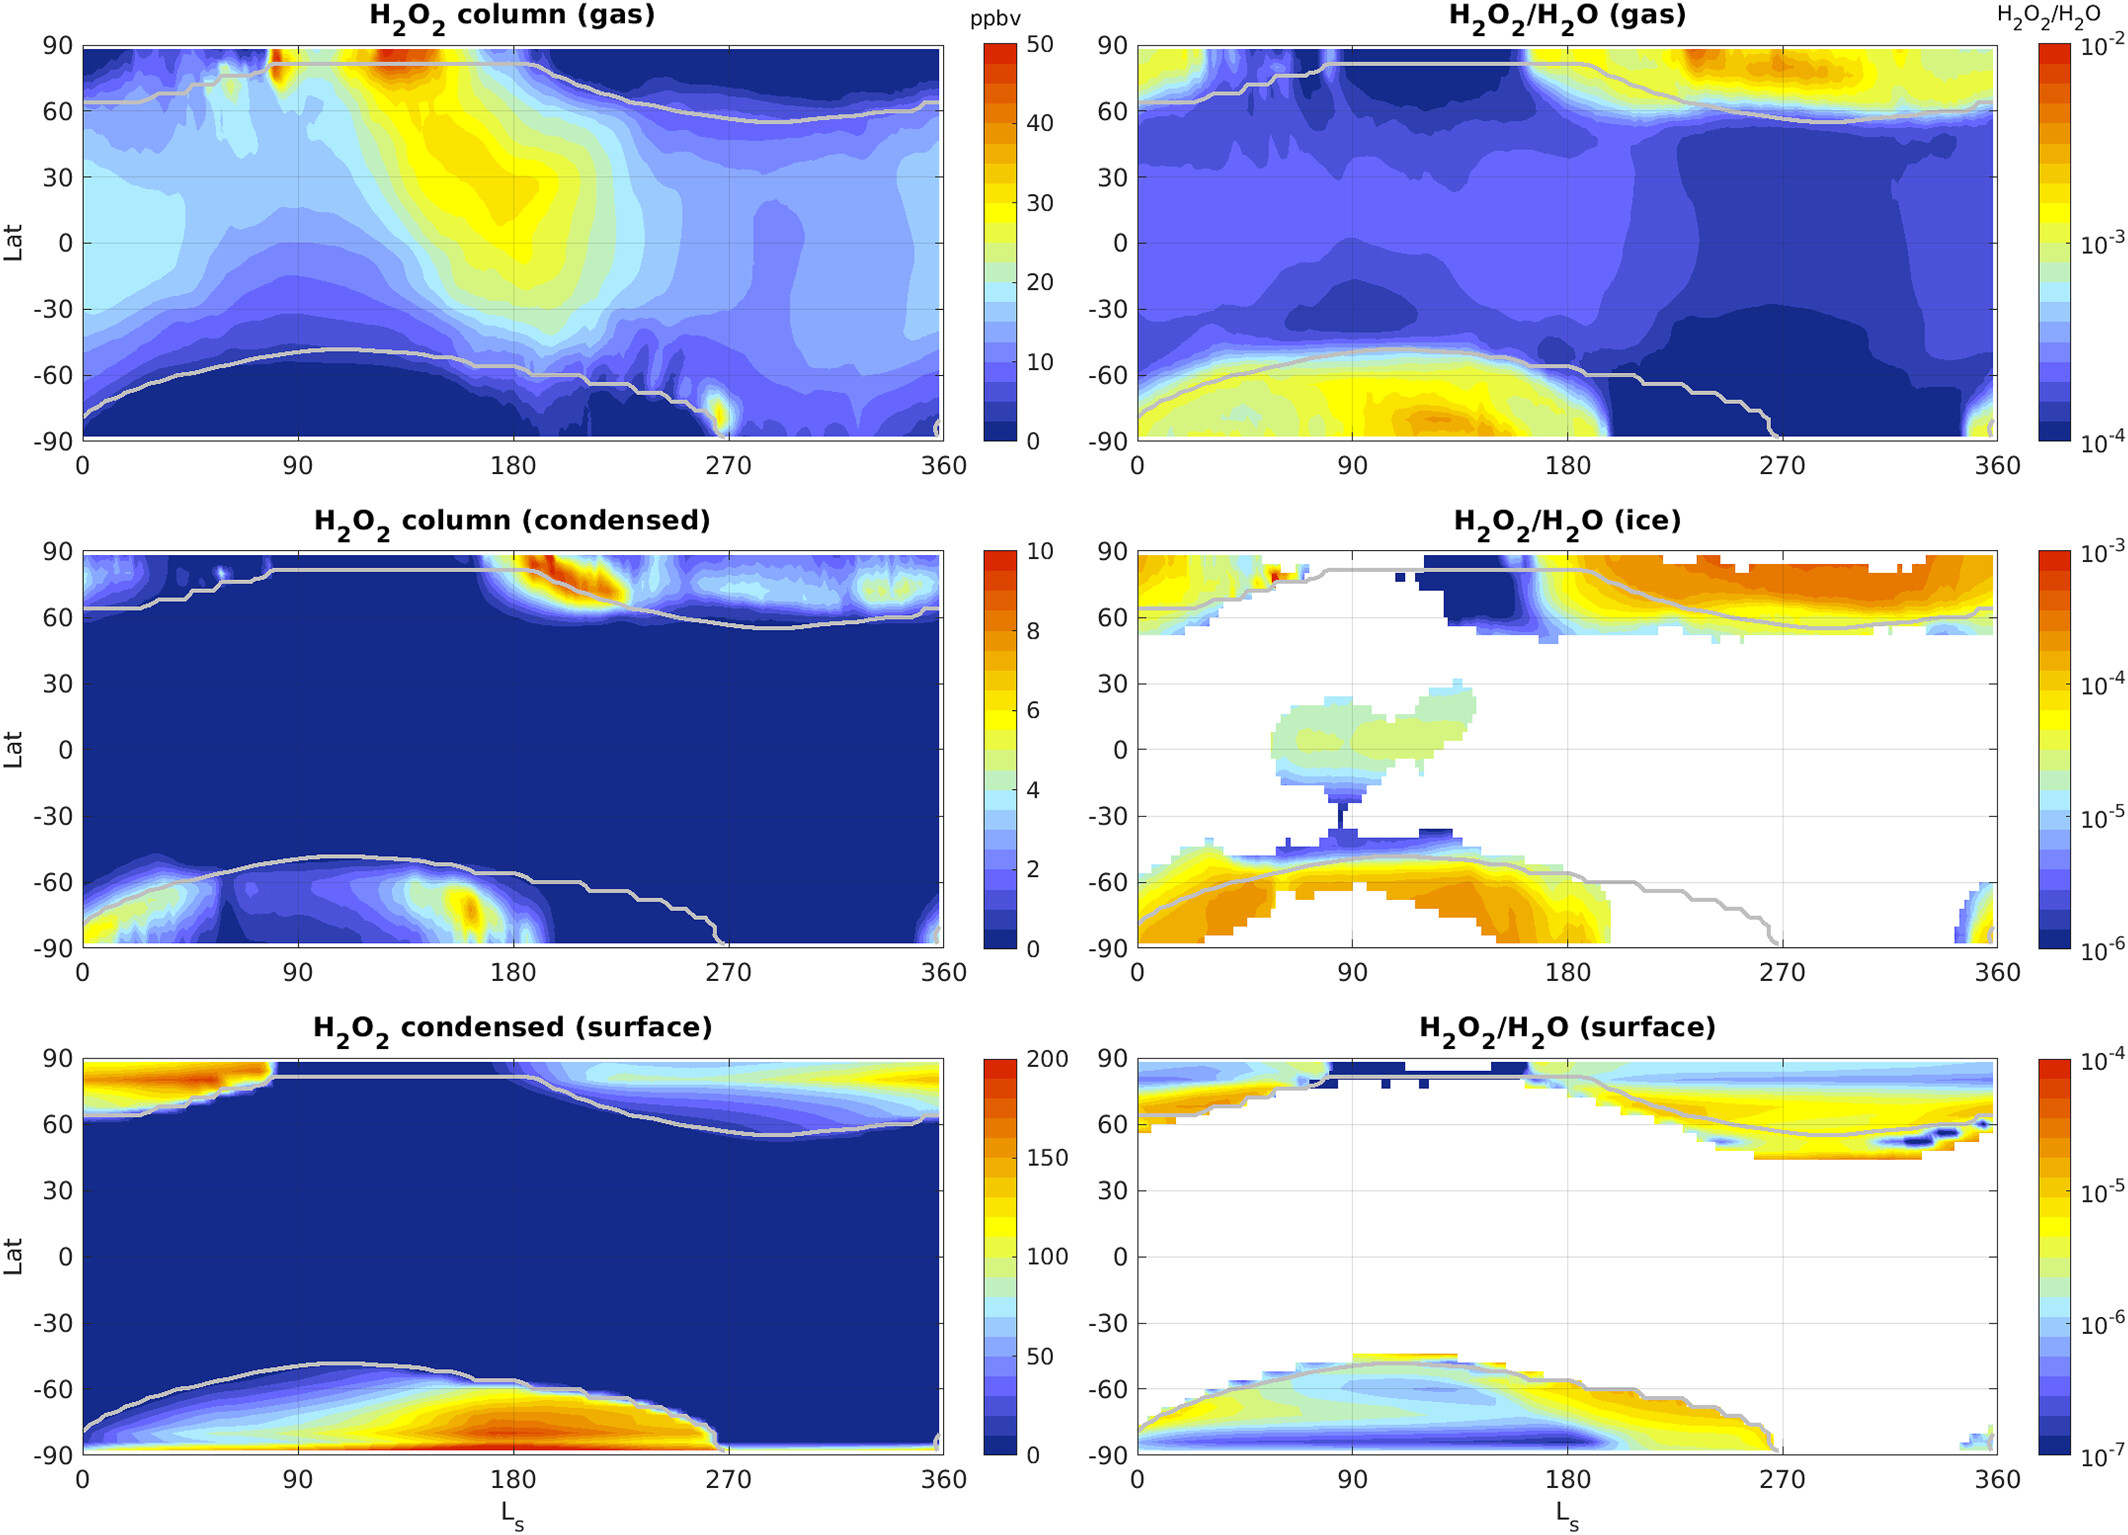
Zonally averaged results from the reference simulation (Hydrogen Peroxide Sublimation, see Table 2). (Left) H2O2 column in the gas-phase (top), and in the condensed phase in the atmosphere (middle) and on the surface (bottom). Total columns are relative to the air column. (Right) H2O2/H2O ratio in the gas phase (top), and in airborne ice (middle) and in surface ice (bottom). All fields were zonally averaged over all longitudes and local times. The gray contour lines represent the edges of the simulated seasonal and permanent polar ice caps. Note the differences in color scale for the various plots.