JGR (2023) https://doi.org/10.1029/2022JE007276
Aurélien Stolzenbach, Miguel-Angel López Valverde, Adrian Brines, Ashimananda Modak, Bernd Funke, Francisco González-Galindo, Ian Thomas, Giuliano Liuzzi, Gerónimo Villanueva, Mikhail Luginin, Shohei Aoki, Udo Grabowski, José Juan Lopez Moreno, Julio Rodrìguez Gòmez, Mike Wolff, Bojan Ristic, Frank Daerden, Giancarlo Bellucci, Manish Patel, Ann-Carine Vandaele
Since the beginning of the Trace Gas Orbiter (TGO) science operations in April 2018, its instrument “Nadir and Occultation for MArs Discovery” (NOMAD) supplies detailed observations of the IR spectrums of the Martian atmosphere. We developed a procedure that allows us to evaluate the composition and distribution's parameters of the atmospheric Martian aerosols. We use a retrieval program (RCP) in conjunction with a radiative forward model (KOPRA) to evaluate the vertical profile of aerosol extinction from NOMAD measurements. We then apply a model/data fitting strategy of the aerosol extinction. In this first article, we describe the method used to evaluate the parameters representing the Martian aerosol composition and size distribution. MY 34 GDS showed a peak intensity from LS 190° to 210°. During this period, the aerosol content rises multiple scale height, reaching altitudes up to 100 km. The lowermost altitude of aerosol's detection during NOMAD observation rises up to 30 km. Dust aerosols reff were observed to be close to 1 μm and its νeff lower than 0.2. Water ice aerosols reff were observed to be submicron with a νeff lower than 0.2. The vertical aerosol structure can be divided in two parts. The lower layers are represented by higher reff than the upper layers. The change between the lower and upper layers is very steep, taking only few kilometers. The decaying phase of the GDS, LS 210°–260°, shows a decrease in altitude of the aerosol content but no meaningful difference in the observed aerosol's size distribution parameters.
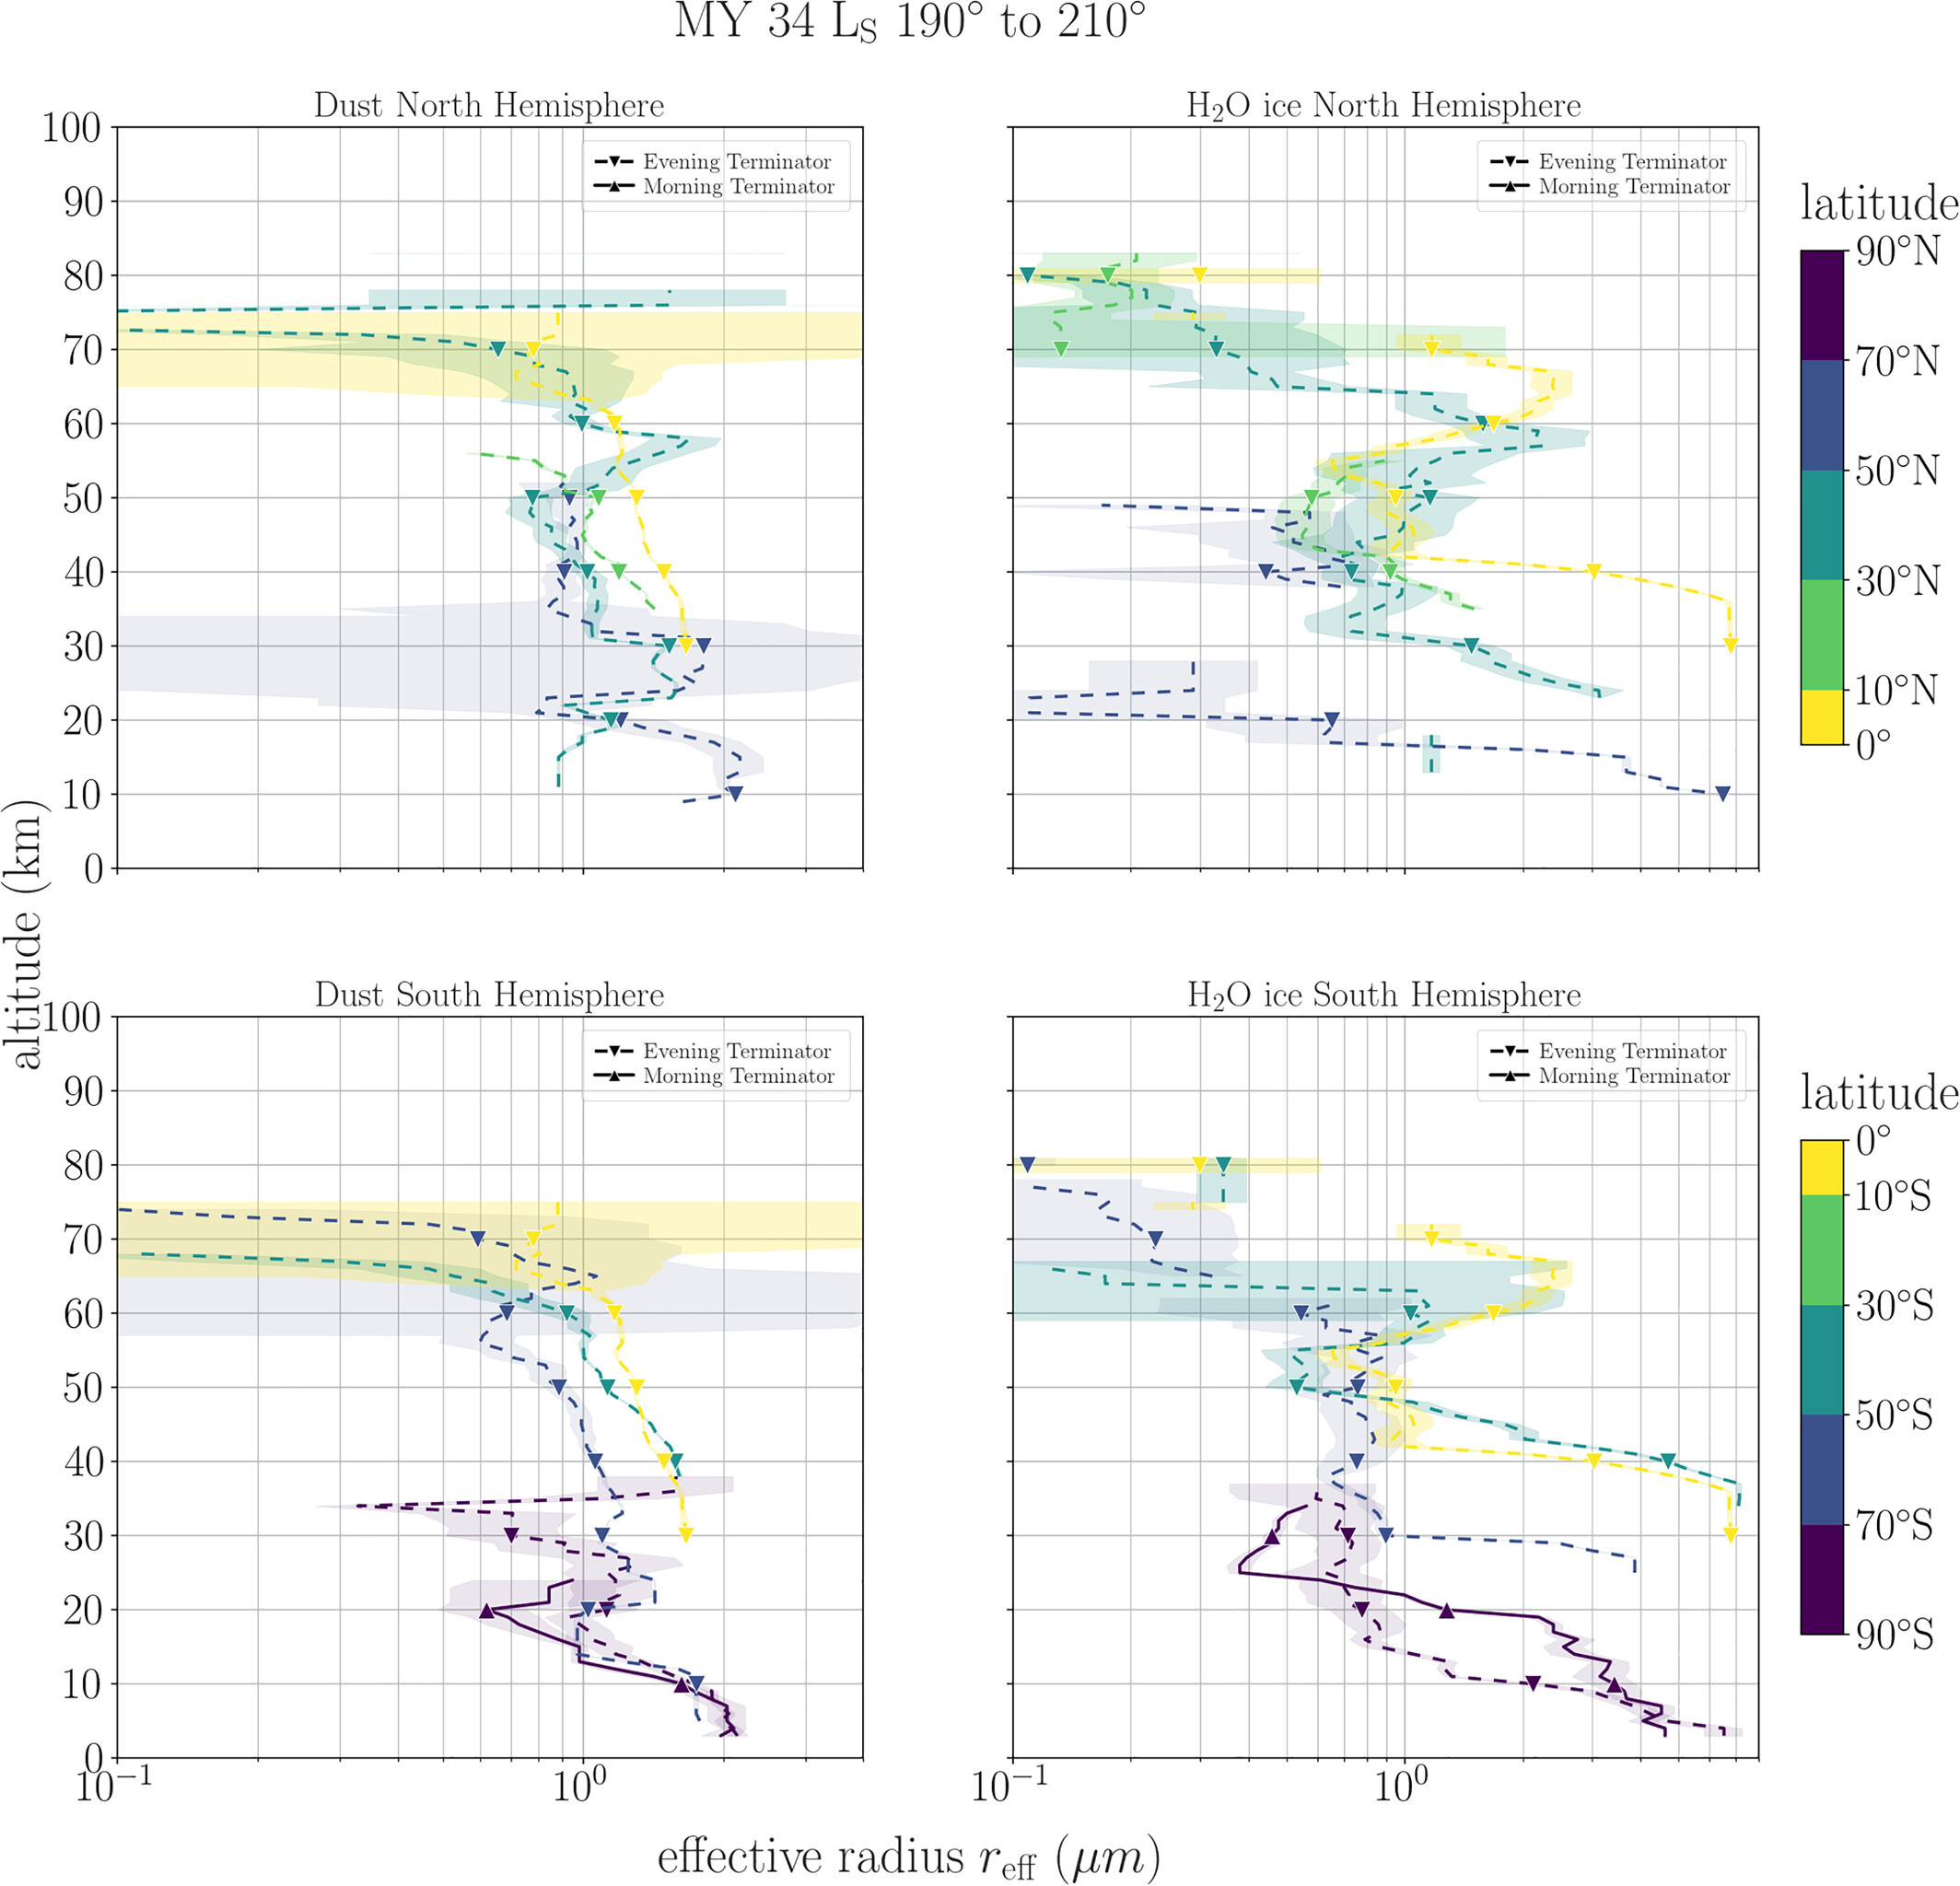
Vertical profiles of the effective radius during the GDS at five latitude ranges. The vertical profiles are derived from a vertical running average using a vertical window of 10 km. The error displayed by the colored area is the greatest value between the standard deviation of the data points and the error in the mean from the running average.