PSJ (2023) https://doi.org/10.3847/PSJ/acd32f
S. Aoki, K. Shiobara, N. Yoshida, L. Trompet, T. Yoshida, N. Terada, H. Nakagawa, G. Liuzzi, A. C. Vandaele, I. R. Thomas
The atmosphere of Mars is mainly composed by carbon dioxide (CO2). It has been predicted that photodissociation of CO2 depletes 13C in carbon monoxide (CO). We present the carbon 13C/12C isotopic ratio in CO at 30–50 km altitude from the analysis of the solar occultation measurements taken by the instrument Nadir and Occultation for Mars Discovery on board the ExoMars Trace Gas Orbiter (ExoMars-TGO). We retrieve 12C16O, 13C16O, and 12C18O volume mixing ratios from the spectra taken at 4112–4213 cm−1, where multiple CO isotope lines with similar intensities are available. The intensities of the 12C16O lines in this spectral range are particularly sensitive to temperature, thus we derive the atmospheric temperature by retrieving CO2 density with simultaneously measured spectra at 2966–2990 cm−1. The mean δ13C value obtained from the 13C16O/12C16O ratios is −263‰, and the standard deviation and standard error of the mean are 132‰ and 4‰, respectively. The relatively large standard deviation is due to the strong temperature dependences in the 12C16O lines. We also examine the 13C16O/12C18O ratio, whose lines are less sensitive to temperature. The mean δ value obtained with 12C18O instead of 12C16O is −82‰ with smaller standard deviation, 60‰. These results suggest that CO is depleted in 13C when compared to CO2 in the Martian atmosphere as measured by the Curiosity rover. This depletion of 13C in CO is consistent with the CO2 photolysis-induced fractionation, which might support a CO-based photochemical origin of organics in Martian sediments.
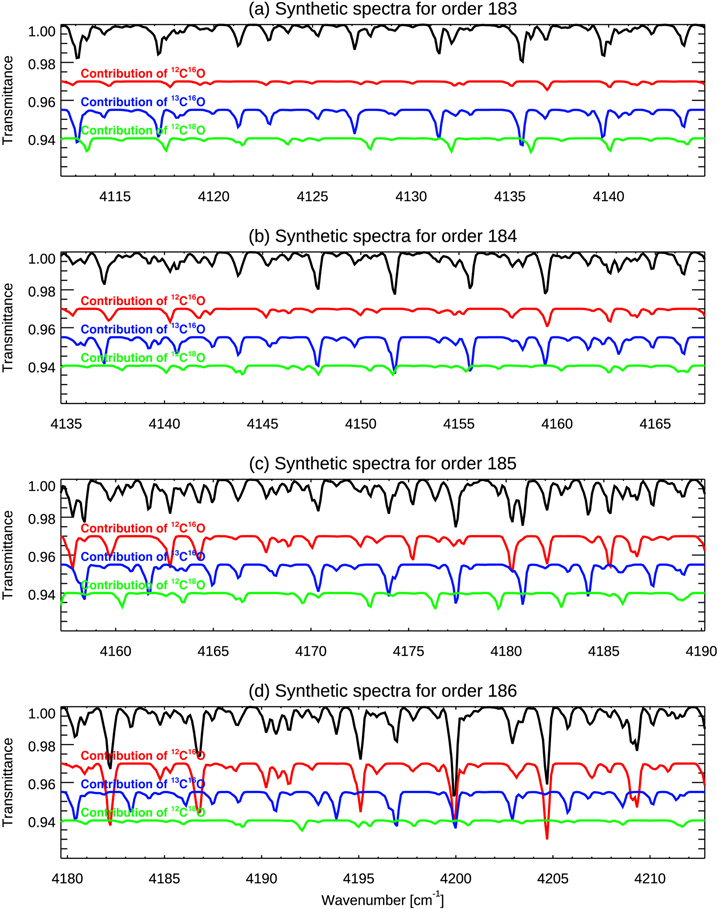
Synthetic spectra of the NOMAD measurements taken with diffraction order 183 (a), order 184 (b), order 185 (c), and order 186 (b) around 30 km tangent height. The assumed vertical profile of total CO volume mixing ratio is 1000 ppm (uniform) and along the line of sight. The isotopic ratios defined in the HITRAN2020 databases are assumed. The red, blue, and green curves illustrate contributions due to 12C16O, 13C16O, and 12C18O absorption lines. The origin of the Y-axis for the red, blue, and green curves have been offset to improve visibility.