JGR (2022); https://doi.org/10.1029/2022JE007231
S. Aoki, A. C. Vandaele, F. Daerden, G. L. Villanueva, G. Liuzzi, R. T. Clancy, M. A. Lopez-Valverde, A. Brines, I. R. Thomas, L. Trompet, J. T. Erwin, L. Neary, S. Robert, A. Piccialli, J. A. Holmes, M. R. Patel, N. Yoshida, J. Whiteway, M. D. Smith, B. Ristic, G. Bellucci, J. J. Lopez-Moreno, A. A. Fedorova
We present water vapor vertical distributions on Mars retrieved from 3.5 years of solar occultation measurements by Nadir and Occultation for Mars Discovery onboard the ExoMars Trace Gas Orbiter, which reveal a strong contrast between aphelion and perihelion water climates. In equinox periods, most of water vapor is confined into the low-middle latitudes. In aphelion periods, water vapor sublimated from the northern polar cap is confined into very low altitudes—water vapor mixing ratios observed at the 0–5 km lower boundary of measurement decrease by an order of magnitude at the approximate altitudes of 15 and 30 km for the latitudes higher than 50°N and 30–50°N, respectively. The vertical confinement of water vapor at northern middle latitudes around aphelion is more pronounced in the morning terminators than evening, perhaps controlled by the diurnal cycle of cloud formation. Water vapor is also observed over the low latitude regions in the aphelion southern hemisphere (0–30°S) mostly below 10–20 km, which suggests north-south transport of water still occurs. In perihelion periods, water vapor sublimated from the southern polar cap directly reaches high altitudes (>80 km) over high southern latitudes, suggesting more effective transport by the meridional circulation without condensation. We show that heating during perihelion, sporadic global dust storms, and regional dust storms occurring annually around 330° of solar longitude (LS) are the main events to supply water vapor to the upper atmosphere above 70 km.
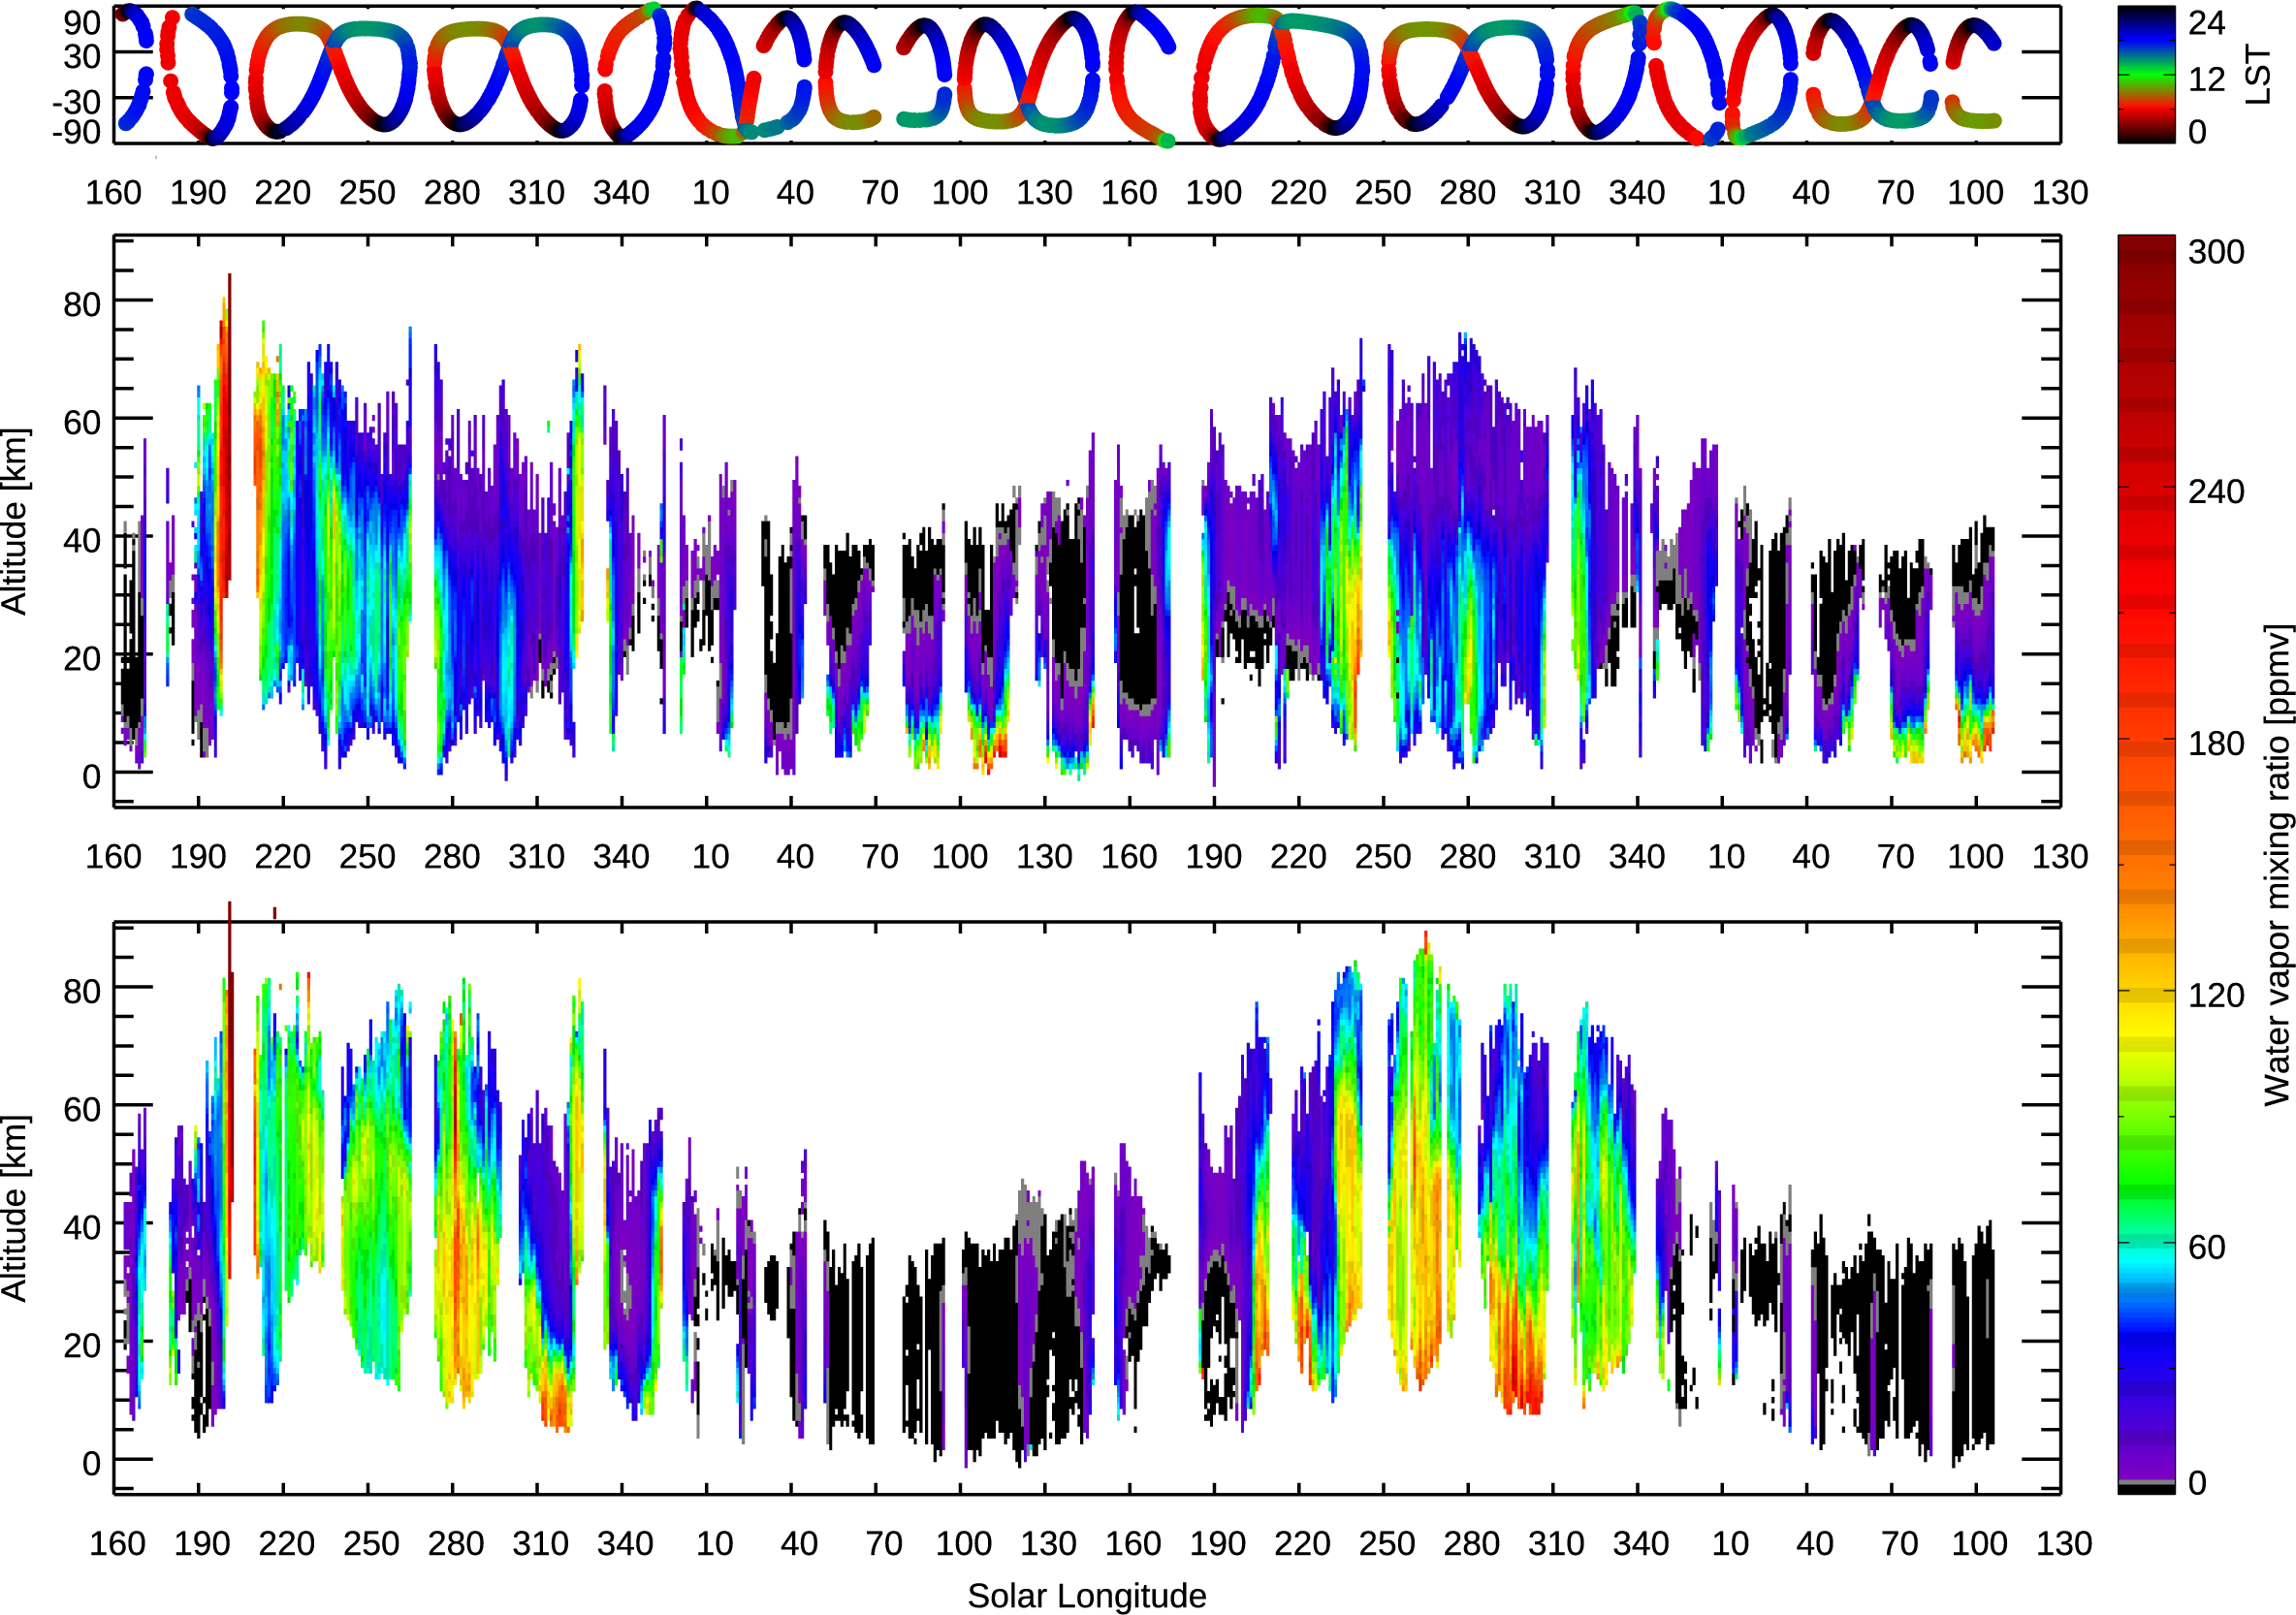
Seasonal variation of the water vapor vertical profiles from LS=160° in MY 34 to LS=130° in MY 36 retrieved from the NOMAD data in the northern hemisphere (the middle panel) and the southern hemisphere (the bottom panel). The retrievals are binned with an interval of 1° of solar longitudes (averaged in latitudes and longitude). The top panel shows the latitudes and local solar time of the measurements (same as Fig. 1). The white represents either no detection or no measurement.