
A&A (2026) https://doi.org/10.1051/0004-6361/202660025
N. Yoshida, S. Aoki, F. Daerden, A. C. Vandaele, H. Nakagawa, J. Erwin, I. Thomas, L. Trompet, T. Imamura, I. Murata, M. A. López-Valverde, A. Brines, L. Neary, N. Terada, A. Fedorova, G. L. Villanueva, G. Liuzzi, A. Modak, Y. Kasaba, M. R. Patal, B. Ristic, G. Bellucci, J. J. López-Moreno
We use carbon monoxide (CO), a long-lived species in the Martian atmosphere, as a tracer to constrain atmospheric transport by characterizing its vertical distribution from the near-surface to an altitude of about 120 km altitude. We retrieved CO vertical profiles from solar occultation (SO) spectra acquired by the SO channel of the Nadir and Occultation for MArs Discovery (NOMAD) instrument on board the ExoMars Trace Gas Orbiter (TGO). The dataset covers Ls = 160◦ in Mars year (MY) 34 to Ls = 120◦ in MY 36, enabling analyses over broader altitude and seasonal ranges than in previous works. We validated the retrievals using co-located measurements from the from Atmospheric Chemistry Suite (ACS) instrument on board TGO. The retrieved CO volume mixing ratio (VMR) is enhanced above 40 km at both poles during seasonal spring and autumn. In summer and winter, the enhancement is largely confined to the winter polar region. These variations are in quantitative agreement with earlier observations and are consistent with seasonal changes in the meridional circulation. We also find larger CO number densities near the morning terminator during local winter in the 80–100 km altitude range, consistent with a modulation of the transport by a semidiurnal tide. During the MY 34 planet-encircling dust event, enhanced CO VMRs are confirmed at 80–110 km in altitude, but no corresponding enhancement in the CO number density is seen, suggesting that the apparent VMR variation is driven primarily by changes in atmospheric dynamics, rather than by photochemistry.
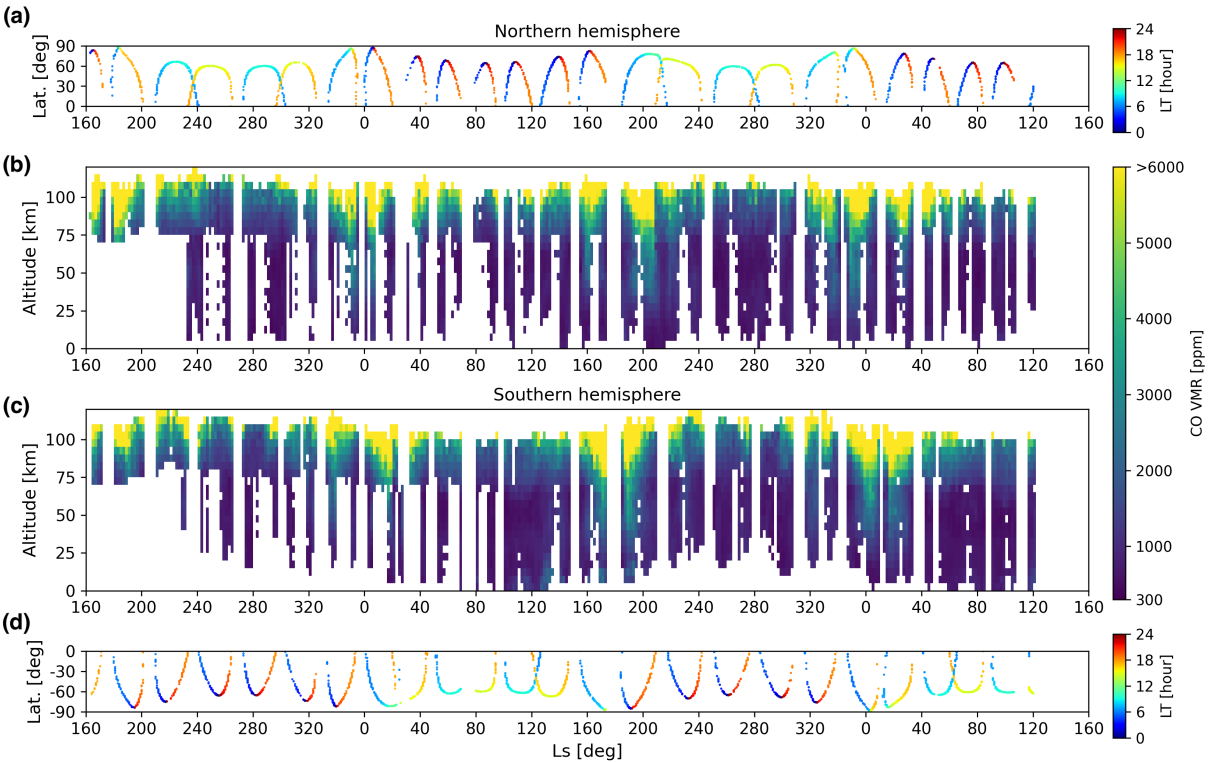
Seasonal variation of CO VMR vertical profiles derived from NOMAD SO. (b) Northern hemisphere and (c) southern hemisphere. Data are binned in 5 km altitude and 2◦ in Ls ; each bin contains at least two profiles. Latitude coverage is shown in (a) and (d), respectively, and the color denotes the local time.