JGR (2022), https://doi.org/10.1029/2022JE007273
A. Brines, M. A. López-Valverde, A. Stolzenbach, A. Modak, B. Funke, F. G. Galindo, S. Aoki, G. L. Villanueva, G. Liuzzi, I. R. Thomas, J. T. Erwin, U. Grabowski, F. Forget, J. J. Lopez-Moreno, J. Rodriguez-Gomez, F. Daerden, L. Trompet, B. Ristic, M. R. Patel, G. Bellucci, A. C. Vandaele
The water vapor in the Martian atmosphere plays a significant role in the planet’s climate, being crucial in most of the chemical and radiative transfer processes. Despite its importance, the vertical distribution of H2O in the atmosphere has not still been characterized precisely enough. The recent ExoMars Trace Gas Orbiter (TGO) mission, with its Nadir and Occultation for MArs Discovery (NOMAD) instrument, has allowed us to measure the H2O vertical distribution with unprecedented resolution. Recent studies of vertical profiles have shown that high dust concentration in the atmosphere, in particular during dust storms, induces an efficient transport of the H2O to higher altitudes, from 40 km up to 80 km. We study the H2O vertical distribution in a subset of solar occultations during the perihelion of two Martian years (MYs), including the 2018 Global Dust Storm (GDS), in order to compare the same Martian season under GDS and non-GDS conditions. We present our state-of-the-art retrieval scheme, and we apply it to a combination of two diffraction orders, which permits sounding up to about 100 km. We confirm recent findings of H2O increasing at high altitudes during Ls = 190-205° in MY 34, reaching abundances of about 150 ppmv at 80 km in both hemispheres not found during the same period of MY 35. We found a hygropause’s steep rising during the GDS from 30 up to 80 km. Furthermore, strong supersaturation events have been identified at mesospheric altitudes even in presence of water ice layers retrieved by the IAA team.
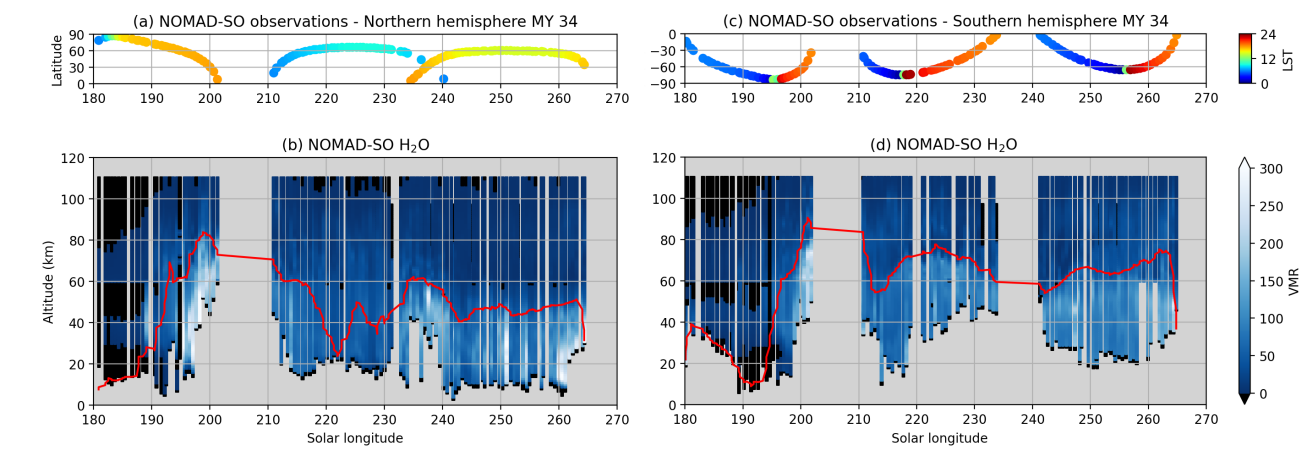
Seasonal vertical distribution maps of the retrieved water vapor (b,d) during the MY 34 in the Northern (left panels) and the Southern (right panels) hemispheres. The red line indicates the hygropause level. Top panels (a,c) show the latitudes and the Local Solar Time of the observations analyzed.