JGR (2022); https://doi.org/10.1029/2022JE007203
J. A. Holmes, S. R. Lewis, M. R. Patel, J. Alday, S. Aoki, G. Liuzzi, G. L. Villanueva, M. M. J. Crismani, A. A. Fedorova, K. S. Olsen, D. M. Kass, A. C. Vandaele, O. Korablev
To understand the evolving martian water cycle, a global perspective of the combined vertical and horizontal distribution of water is needed in relation to supersaturation and water loss and how it varies spatially and temporally. The global vertical water vapor distribution is investigated through an analysis that unifies water, temperature and dust retrievals from several instruments on multiple spacecraft throughout Mars Year (MY) 34 with a global circulation model. During the dusty season of MY 34, northern polar latitudes are largely absent of water vapor below 20 km with variations above this altitude due to transport from mid-latitudes during a global dust storm, the downwelling branch of circulation during perihelion season and the intense MY 34 southern summer regional dust storm. Evidence is found of supersaturated water vapor breaking into the northern winter polar vortex. Supersaturation above around 60 km is found for most of the time period, with lower altitudes showing more diurnal variation in the saturation state of the atmosphere. Discrete layers of supersaturated water are found across all latitudes. The global dust storm and southern summer regional dust storm forced water vapor at all latitudes in a supersaturated state to 60–90 km where it is more likely to escape from the atmosphere. The reanalysis data set provides a constrained global perspective of the water cycle in which to investigate the horizontal and vertical transport of water throughout the atmosphere, of critical importance to understand how water is exchanged between different reservoirs and escapes the atmosphere.
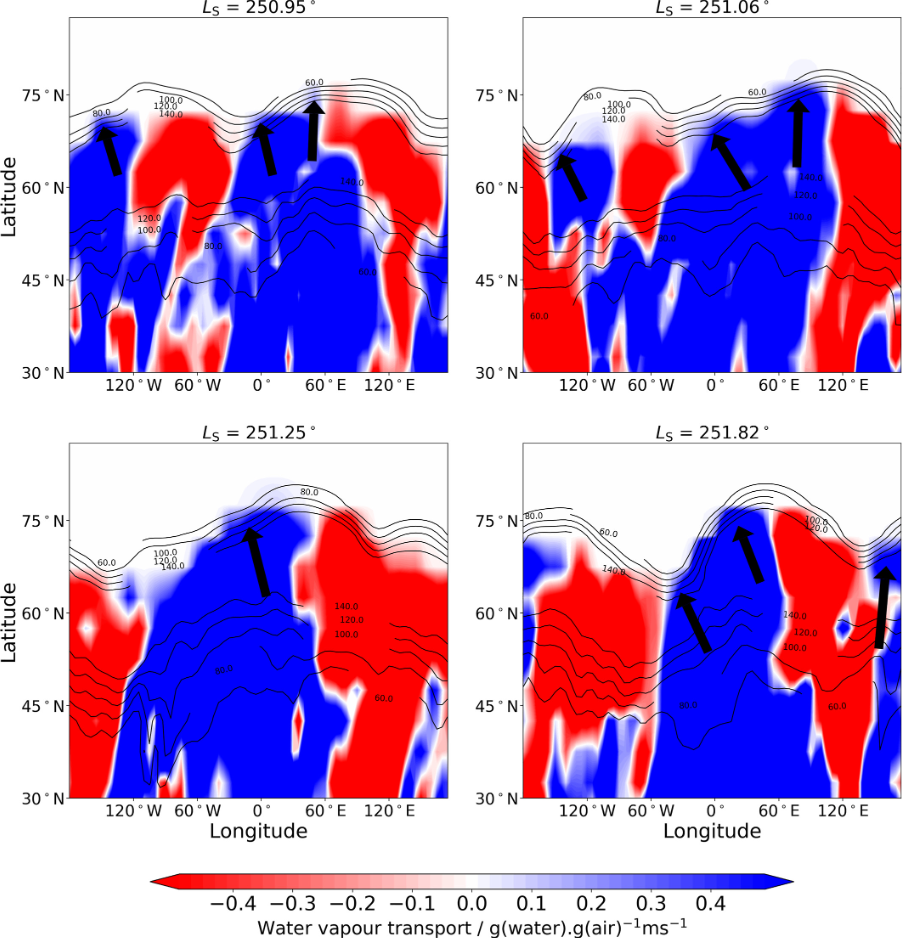
Longitude-latitude maps at 35 km of the meridional transport of water vapor in the water reanalysis at the time specified above each subplot. Blue/red indicates transport to the north/south. Black contours indicate the zonal wind at 35 km. Black arrows indicate where water vapor is crossing the northern winter polar vortex boundary.