GRL (2022) https://doi.org/10.1029/2022GL098821
F. Daerden, L. Neary, M. J. Wolff, R. T. Clancy, F. Lefèvre, J. A. Whiteway, S. Viscardy, A. Piccialli, Y. Willame, C. Depiesse, S. Aoki, I. R. Thomas, B. Ristic, J. Erwin, J.-C. Gérard, B. J. Sandor, A. Khayat, M. D. Smith, J. P. Mason, M. R. Patel, G. L. Villanueva, G. Liuzzi, G. Bellucci, J.-J. Lopez-Moreno, A. C. Vandaele
The NOMAD/UVIS spectrometer on the ExoMars Trace Gas Orbiter provided observations of ozone and water vapor in the global dust storm of 2018. Here we show in detail, using advanced data filtering and chemical modeling, how Martian ozone in the middle atmosphere was destroyed during the dust storm. In data taken exactly one year later when no dust storm occurred, the normal situation had been reestablished. The model simulates how water vapor is transported to high altitudes and latitudes in the storm, where it photolyses to form odd hydrogen species that catalyze ozone. Ozone destruction is simulated at all latitudes and up to 100 km, except near the surface where it increases. The simulations also predict a strong increase in the photochemical production of atomic hydrogen in the middle atmosphere, consistent with the enhanced hydrogen escape observed in the upper atmosphere during global dust storms.
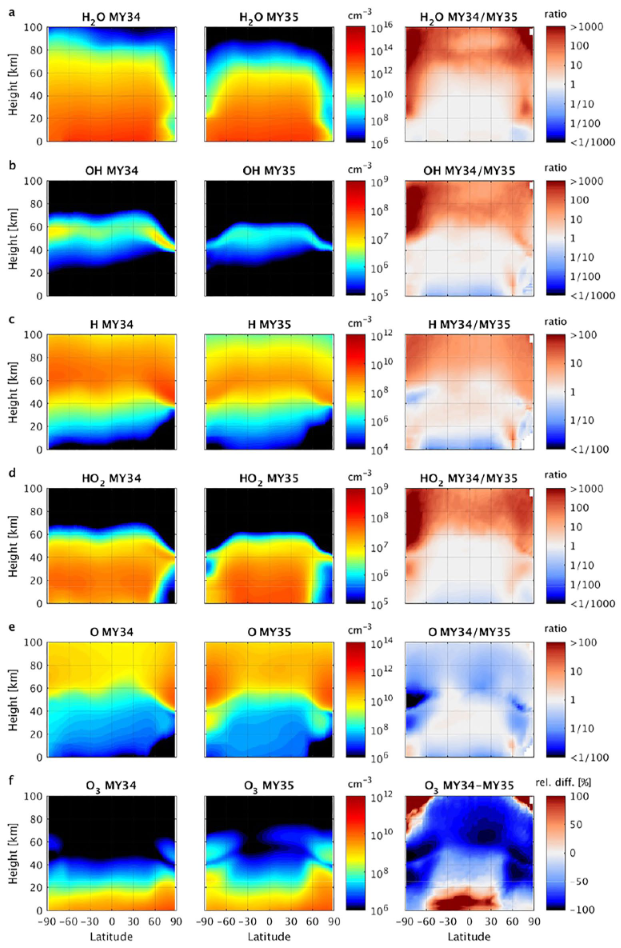
Latitude-height cross-sections of the simulated number densities of H2O, OH, H, HO2, O and O3 for MY34 (left column) and MY35 (center column), averaged over Ls = 210°–220° (period which falls in the global dust storm (GDS) in MY34). The right column show the ratio of the averaged number densities in MY34 and MY35, except for O3 for which the relative difference is shown. The densities from both years were first interpolated to a common altitude grid as the atmospheric height scale changed during the GDS.