JGR Planets (2022) https://doi.org/10.1029/2021JE007083
F. Oliva, E. D’Aversa, G. Bellucci, F. G. Carrozzo, L. Ruiz Lozano, F. Altieri, I. R. Thomas, O. Karatekin, G. Cruz Mermy, F. Schmidt, S. Robert, A. C. Vandaele, F. Daerden, B. Ristic, M. R. Patel, J.-J. López-Moreno, G. Sindoni
The Nadir and Occultation for MArs Discovery (NOMAD) instrument suite aboard ExoMars/Trace Gas Orbiter spacecraft is mainly conceived for the study of minor atmospheric species, but it also offers the opportunity to investigate surface composition and aerosols properties. We investigate the information content of the Limb, Nadir, and Occultation (LNO) infrared channel of NOMAD and demonstrate how spectral orders 169, 189, and 190 can be exploited to detect surface CO2 ice. We study the strong CO2 ice absorption band at 2.7 μm and the shallower band at 2.35 μm taking advantage of observations across Martian Years 34 and 35 (March 2018 to February 2020), straddling a global dust storm. We obtain latitudinal-seasonal maps for CO2 ice in both polar regions, in overall agreement with predictions by a general climate model and with the Mars Express/OMEGA spectrometer Martian Years 27 and 28 observations. We find that the narrow 2.35 μm absorption band, spectrally well covered by LNO order 189, offers the most promising potential for the retrieval of CO2 ice microphysical properties. Occurrences of CO2 ice spectra are also detected at low latitudes and we discuss about their interpretation as daytime high altitude CO2 ice clouds as opposed to surface frost. We find that the clouds hypothesis is preferable on the basis of surface temperature, local time and grain size considerations, resulting in the first detection of CO2 ice clouds through the study of this spectral range. Through radiative transfer considerations on these detections we find that the 2.35 μm absorption feature of CO2 ice clouds is possibly sensitive to nm-sized ice grains.
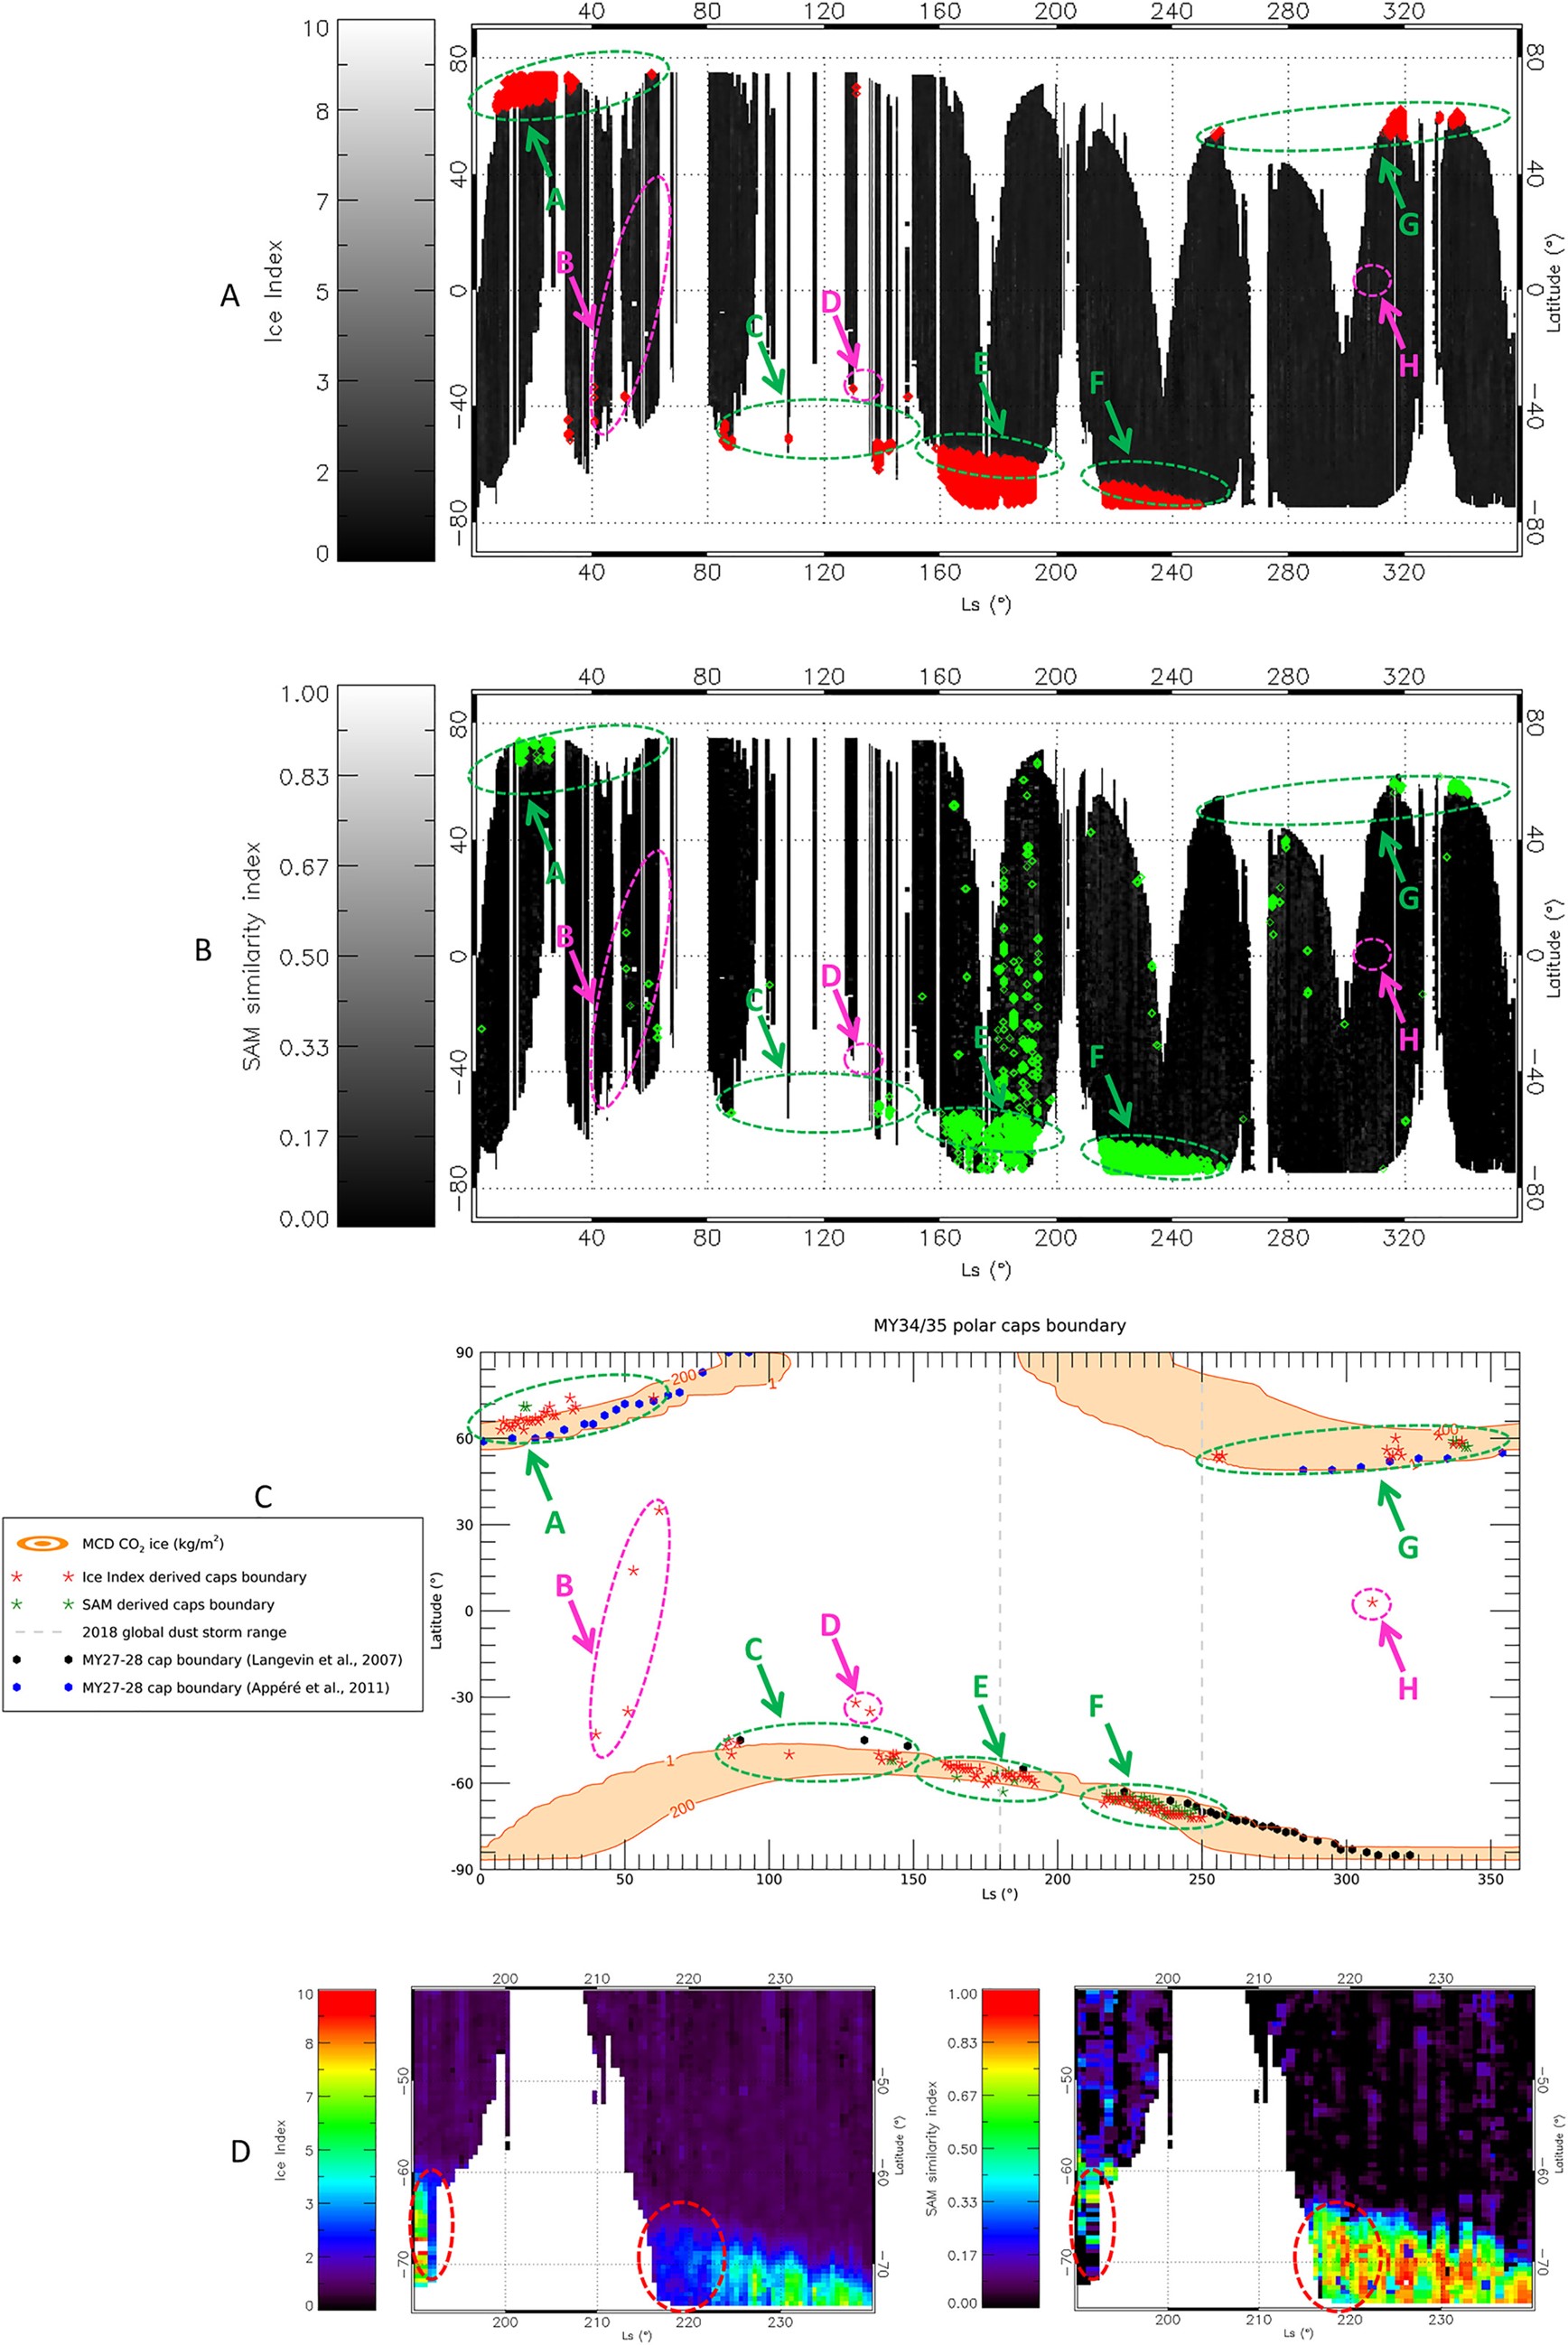
In all panels, Ls between 0° and 150° refer to MY35, while Ls between 150° and 360° are related to MY34. Panels (a and b) Ice Index (a) and Spectral Angle Mapper (SAM) χ (b) maps where red and green points indicate regions with Ice Index >2 and SAM index χ >0.2 respectively (see Section 4.1 and Section 4.2). Colored labeled arrows indicate structures of interest identified in panel (c), on the polar caps (green) and at mid-latitudes (magenta, Section 5.1). Panel (c) red and green stars indicate the polar caps boundaries estimated through Ice Index and SAM similarity index χ respectively (Section 5). These are compared to the MCD simulated abundances of CO2 ice corresponding to the observed cap boundaries positions (orange regions, representing surface column mass densities in kg/m2) and to OMEGA observations (black and blue dots for the South and North poles respectively) from MY27-28 (Appéré et al., 2011; Langevin et al., 2007). The dashed gray lines indicate the 2018 global dust storm Ls range. Panel (d) comparison of the South polar cap in the Ice Index and SAM χ index maps within the storm Ls range. The red dashed circles indicate regions in which the dust storm strongly impacts the Ice Index value.